Health Hue Hub · Reporting
Know your numbers. Grow on purpose.
Revenue, bookings, lead source, provider performance, and retention, all in one live dashboard. Every appointment, payment, and ad click feeds the numbers automatically, so you run the clinic on facts instead of a month-old spreadsheet.
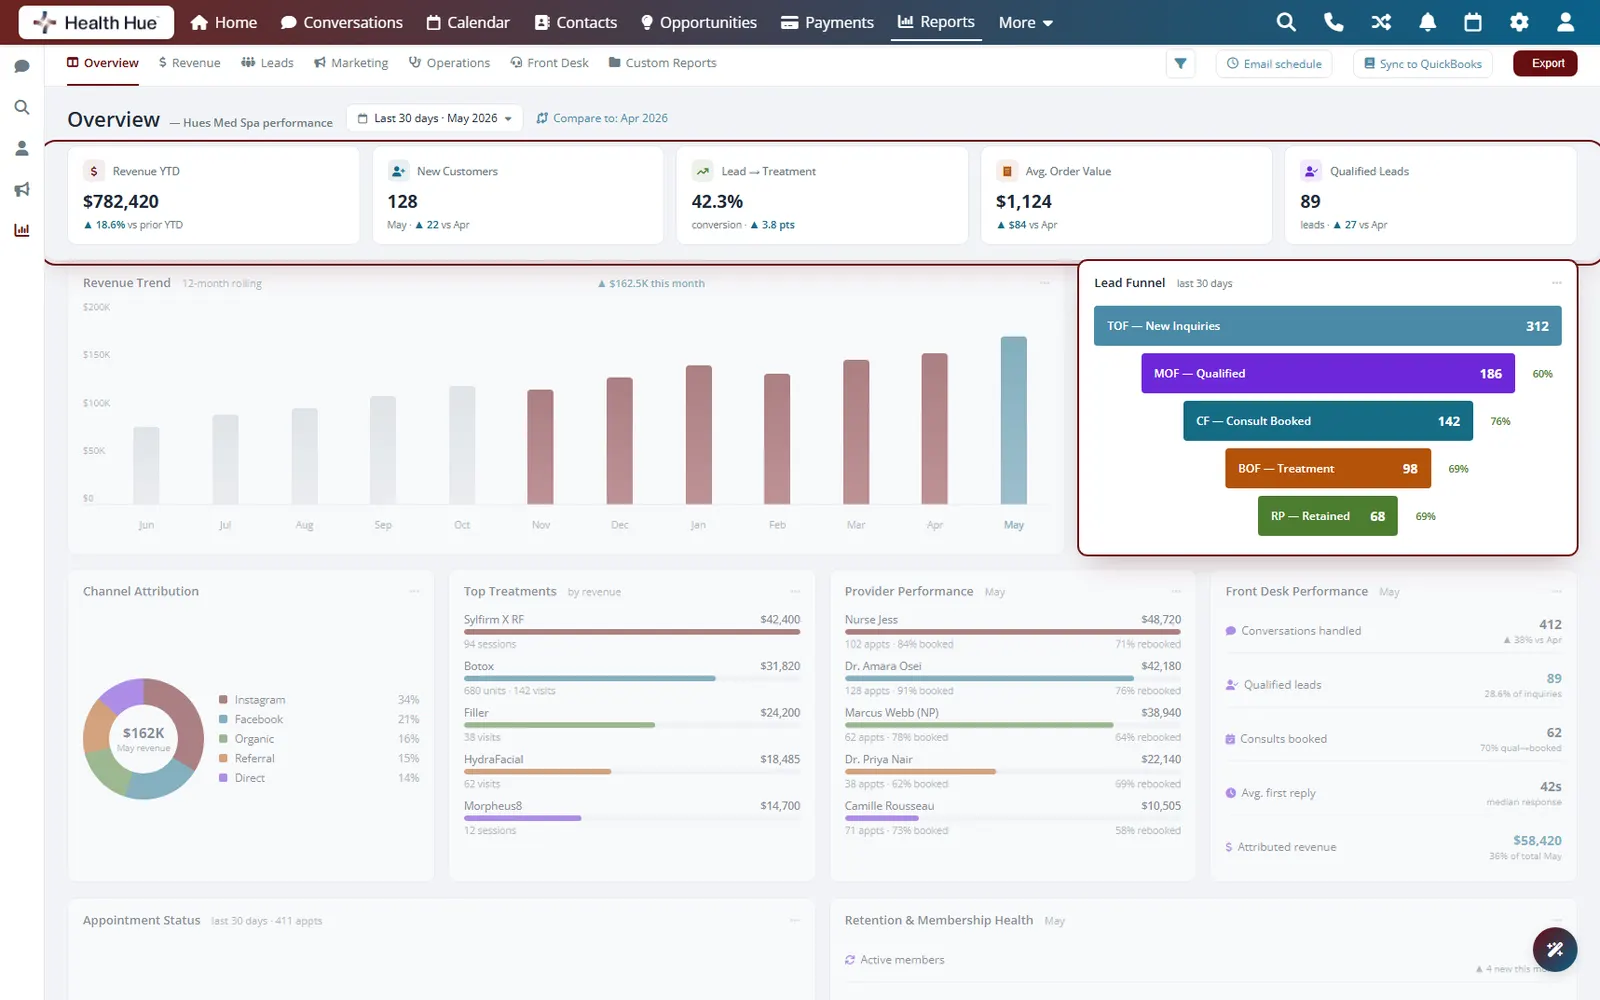

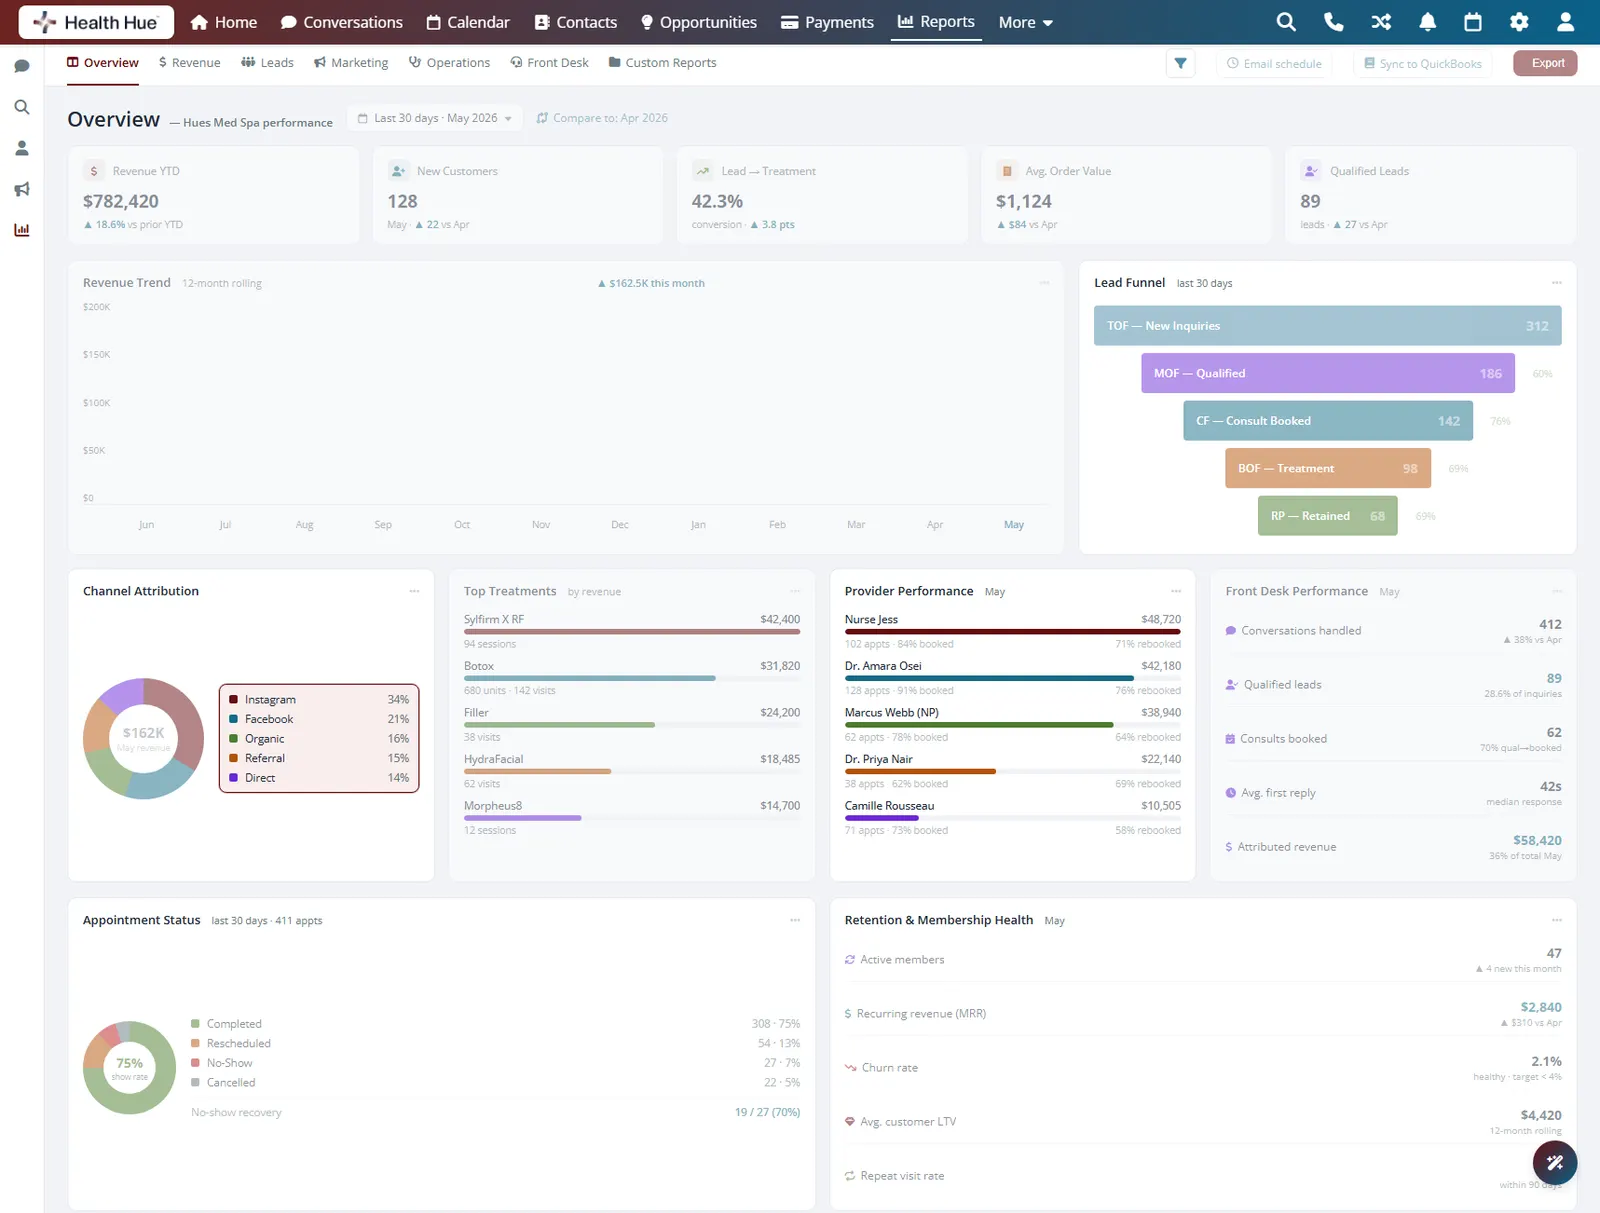
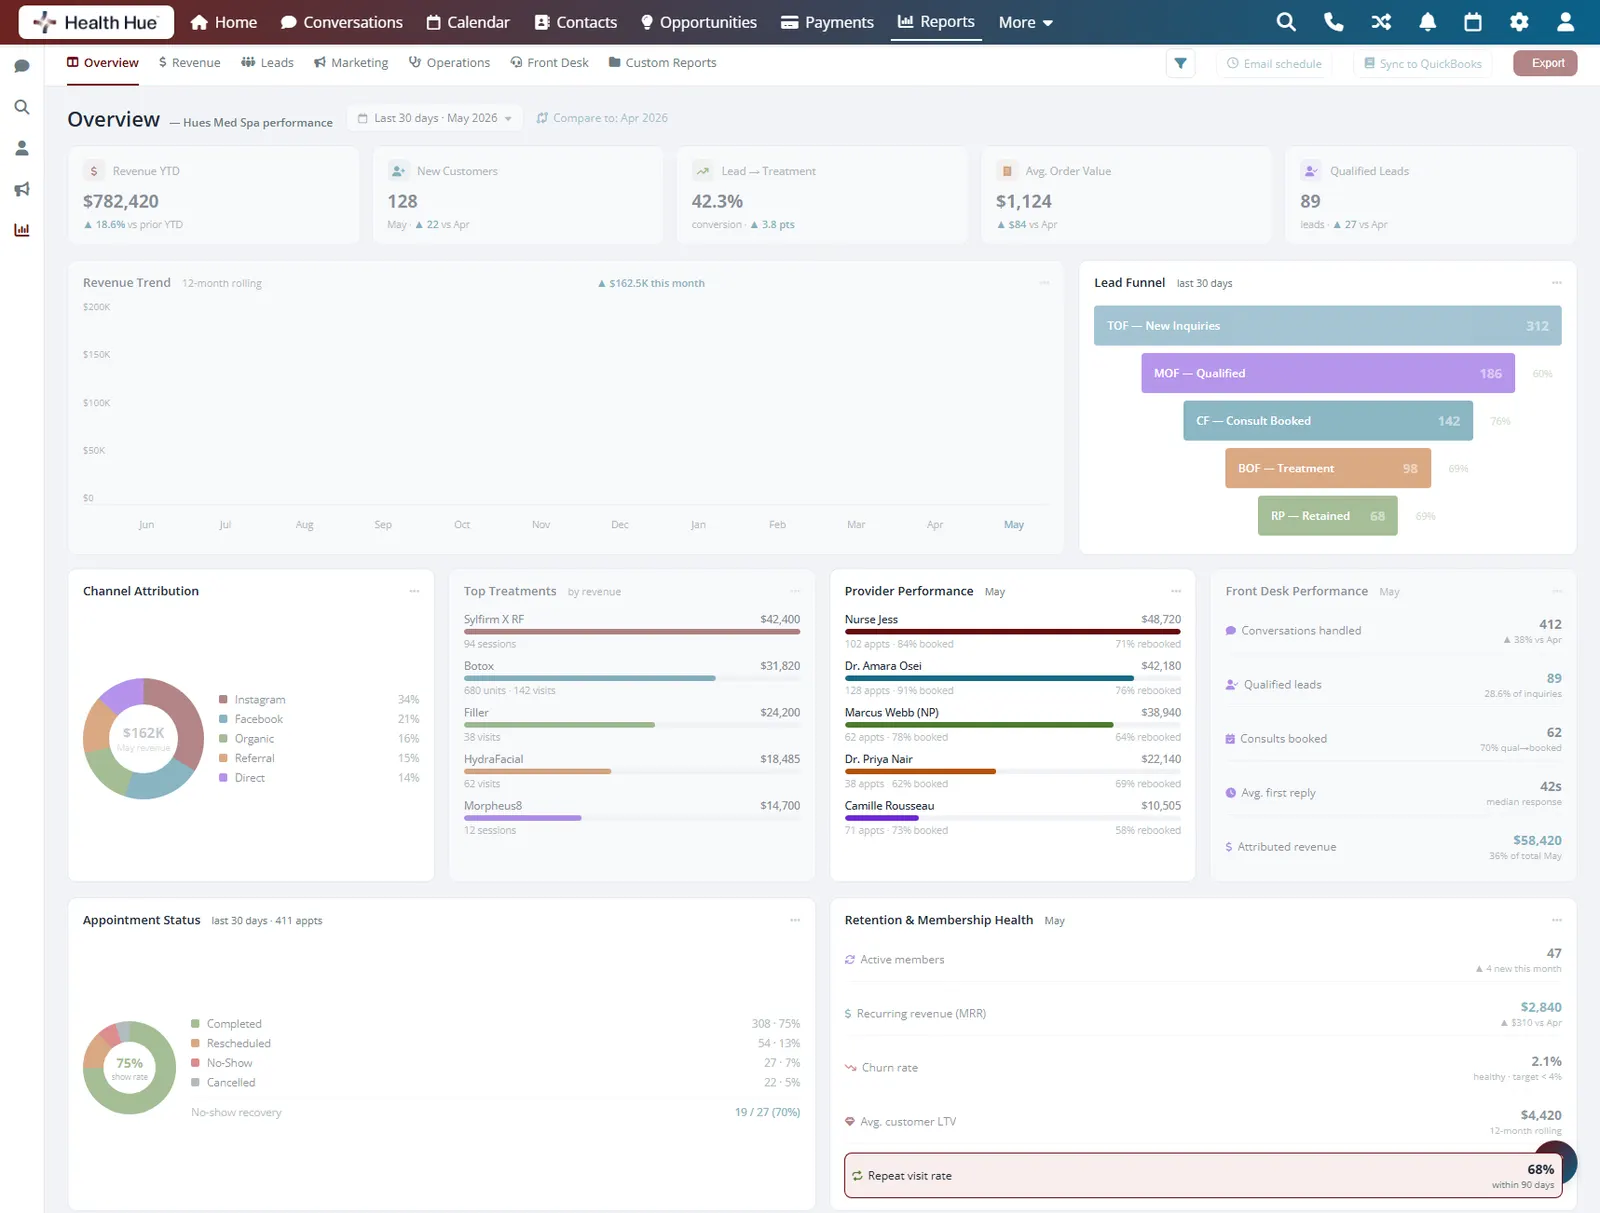
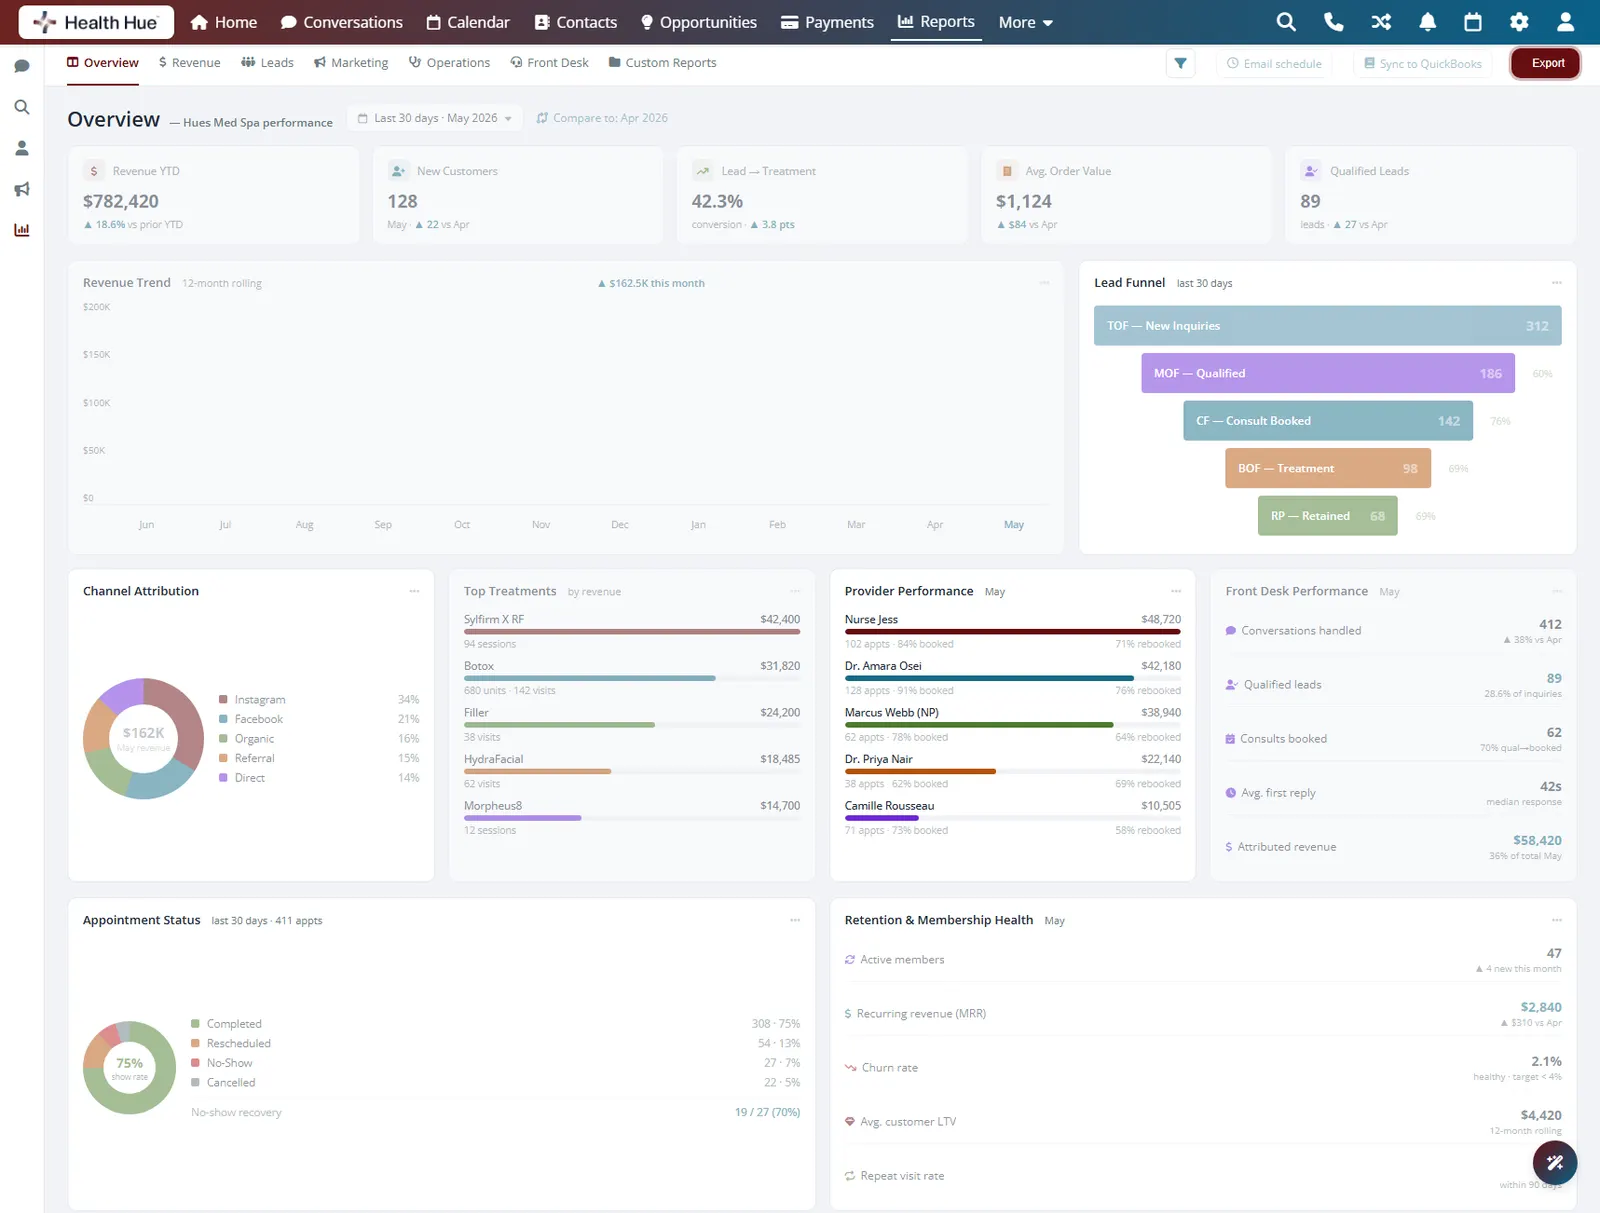
01 · Revenue & KPI Overview
See the whole business at a glance.
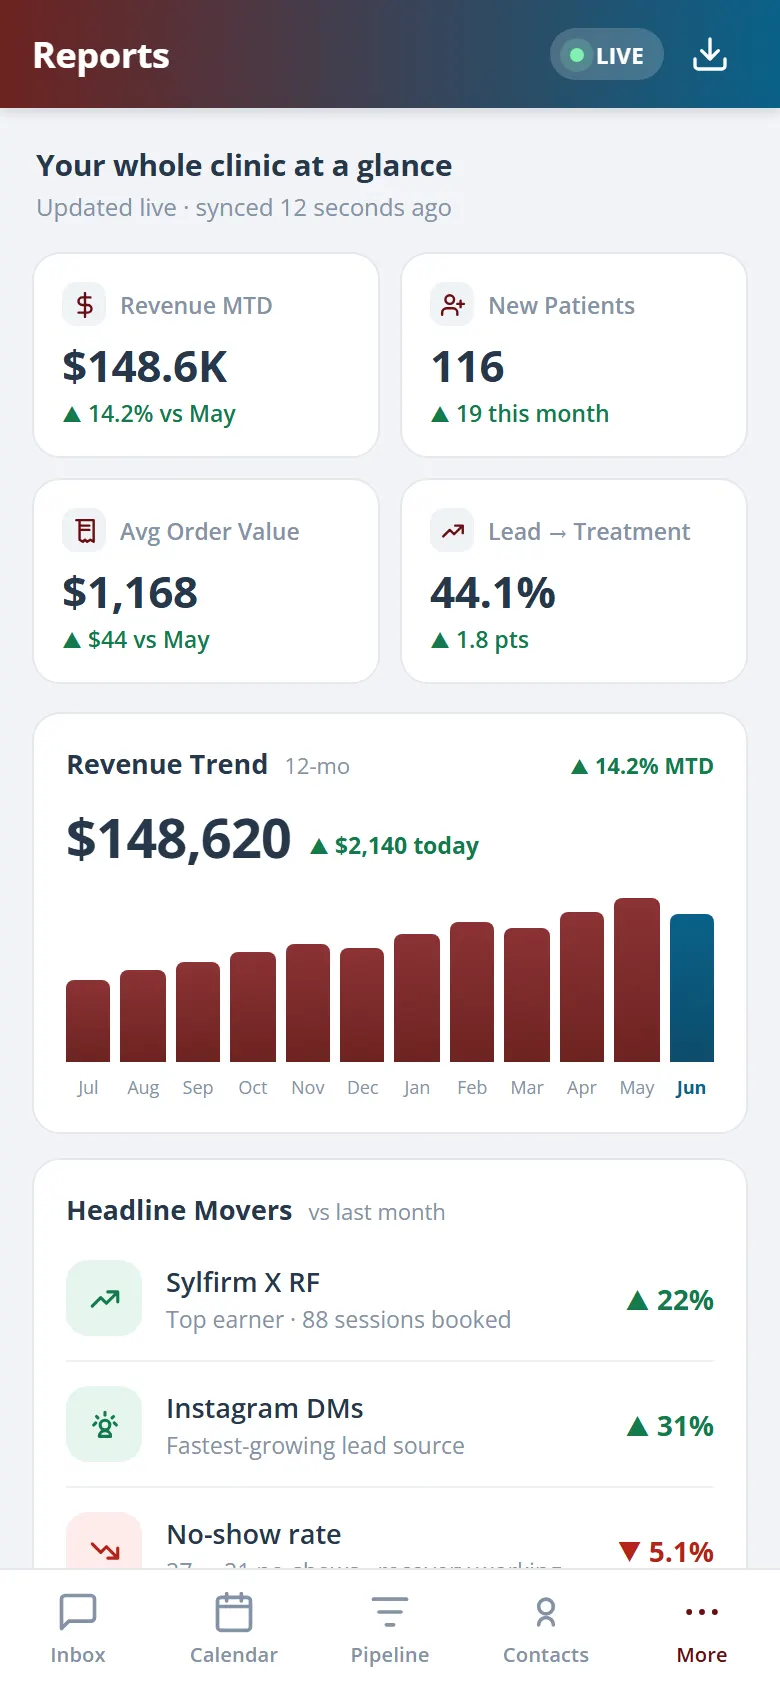
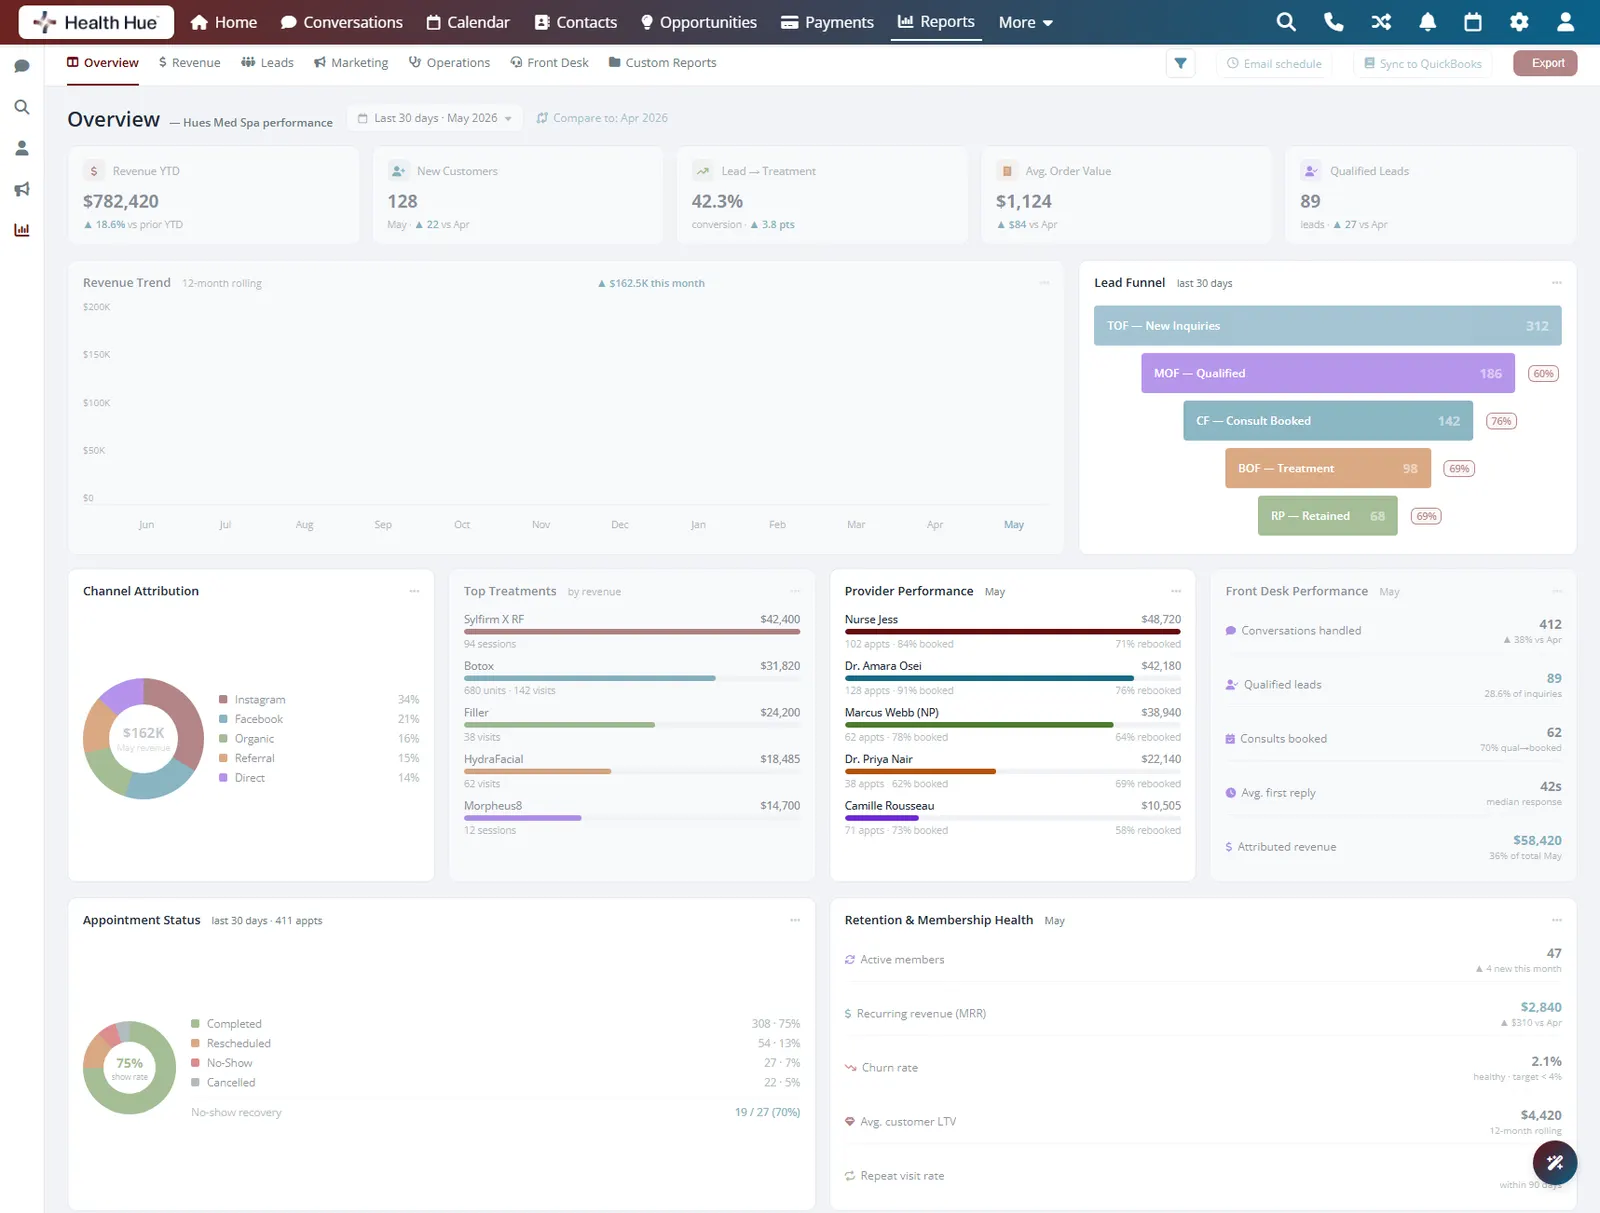
Open the dashboard and revenue, bookings, new patients, and average ticket are already there for today, this week, and this month. No exports, no formulas. The numbers update the moment an appointment is booked or a payment clears.
Revenue and bookings update in real time as the clinic runs.
Switch between today, this week, this month, or a custom range.
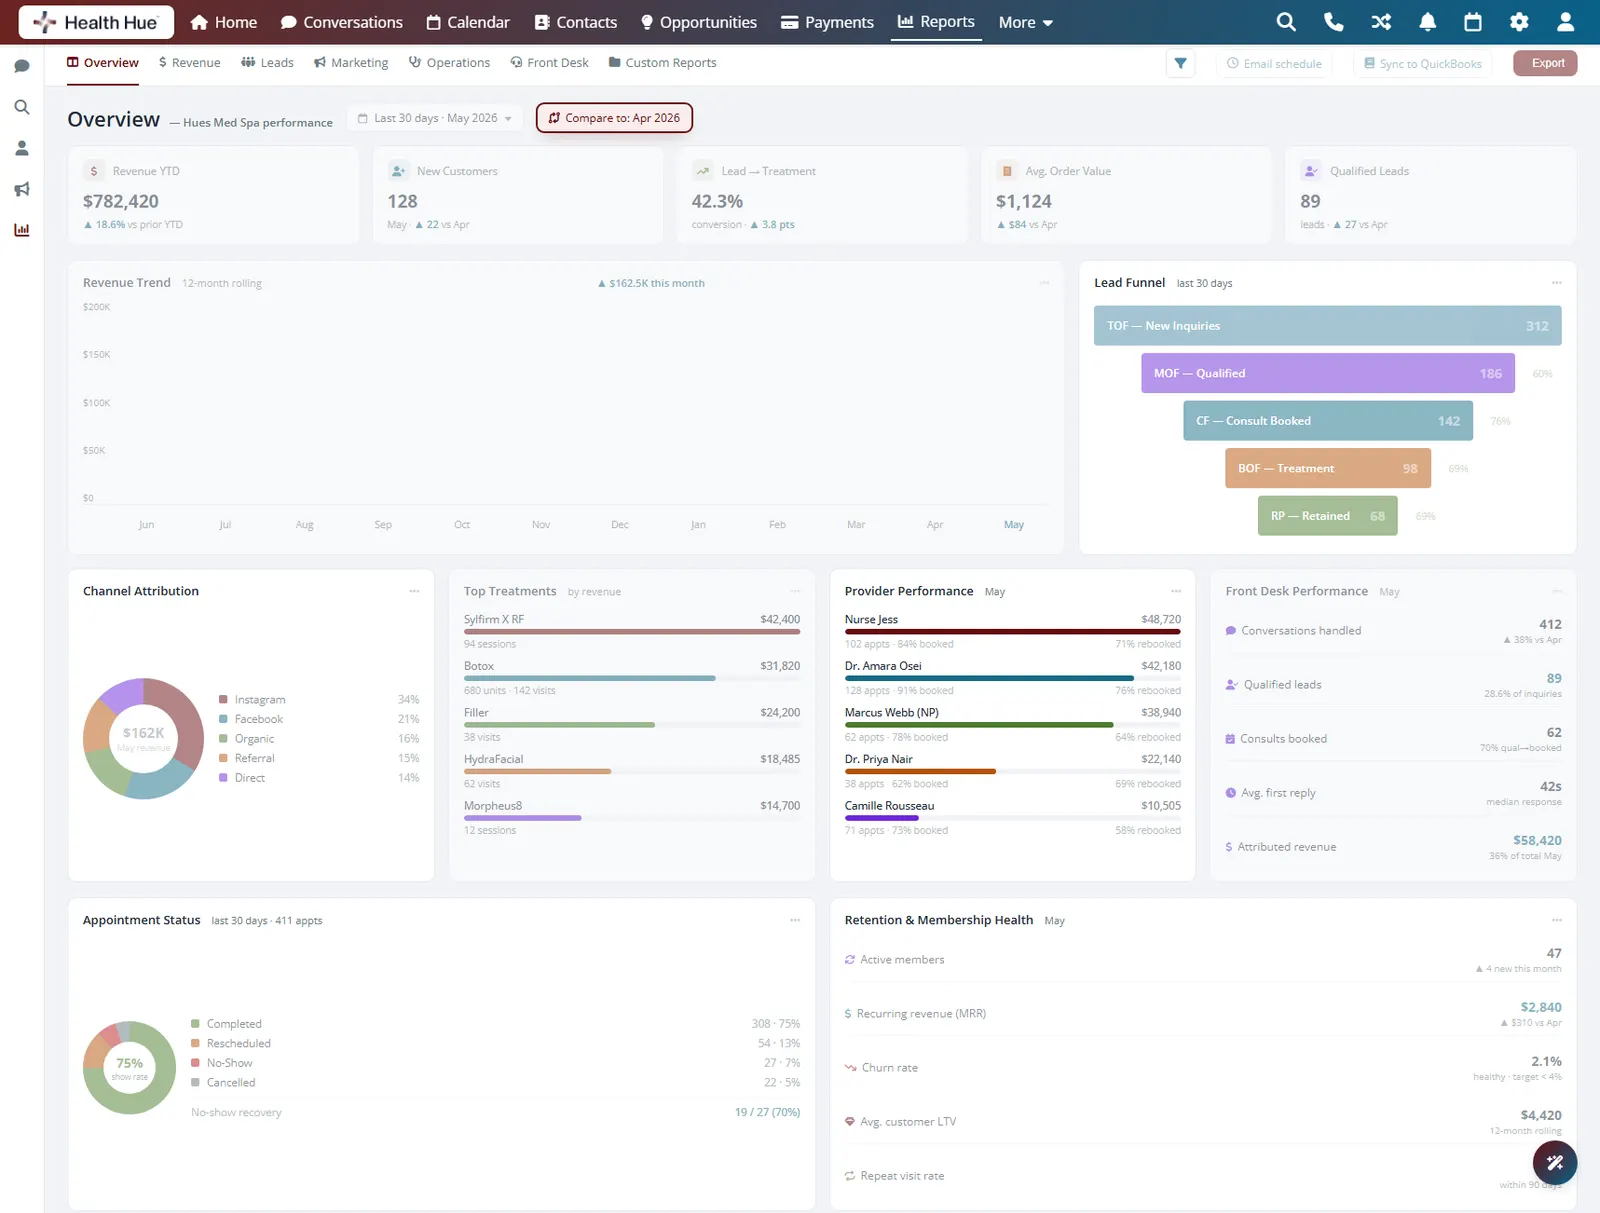
Stack this period against the last to see the trend.


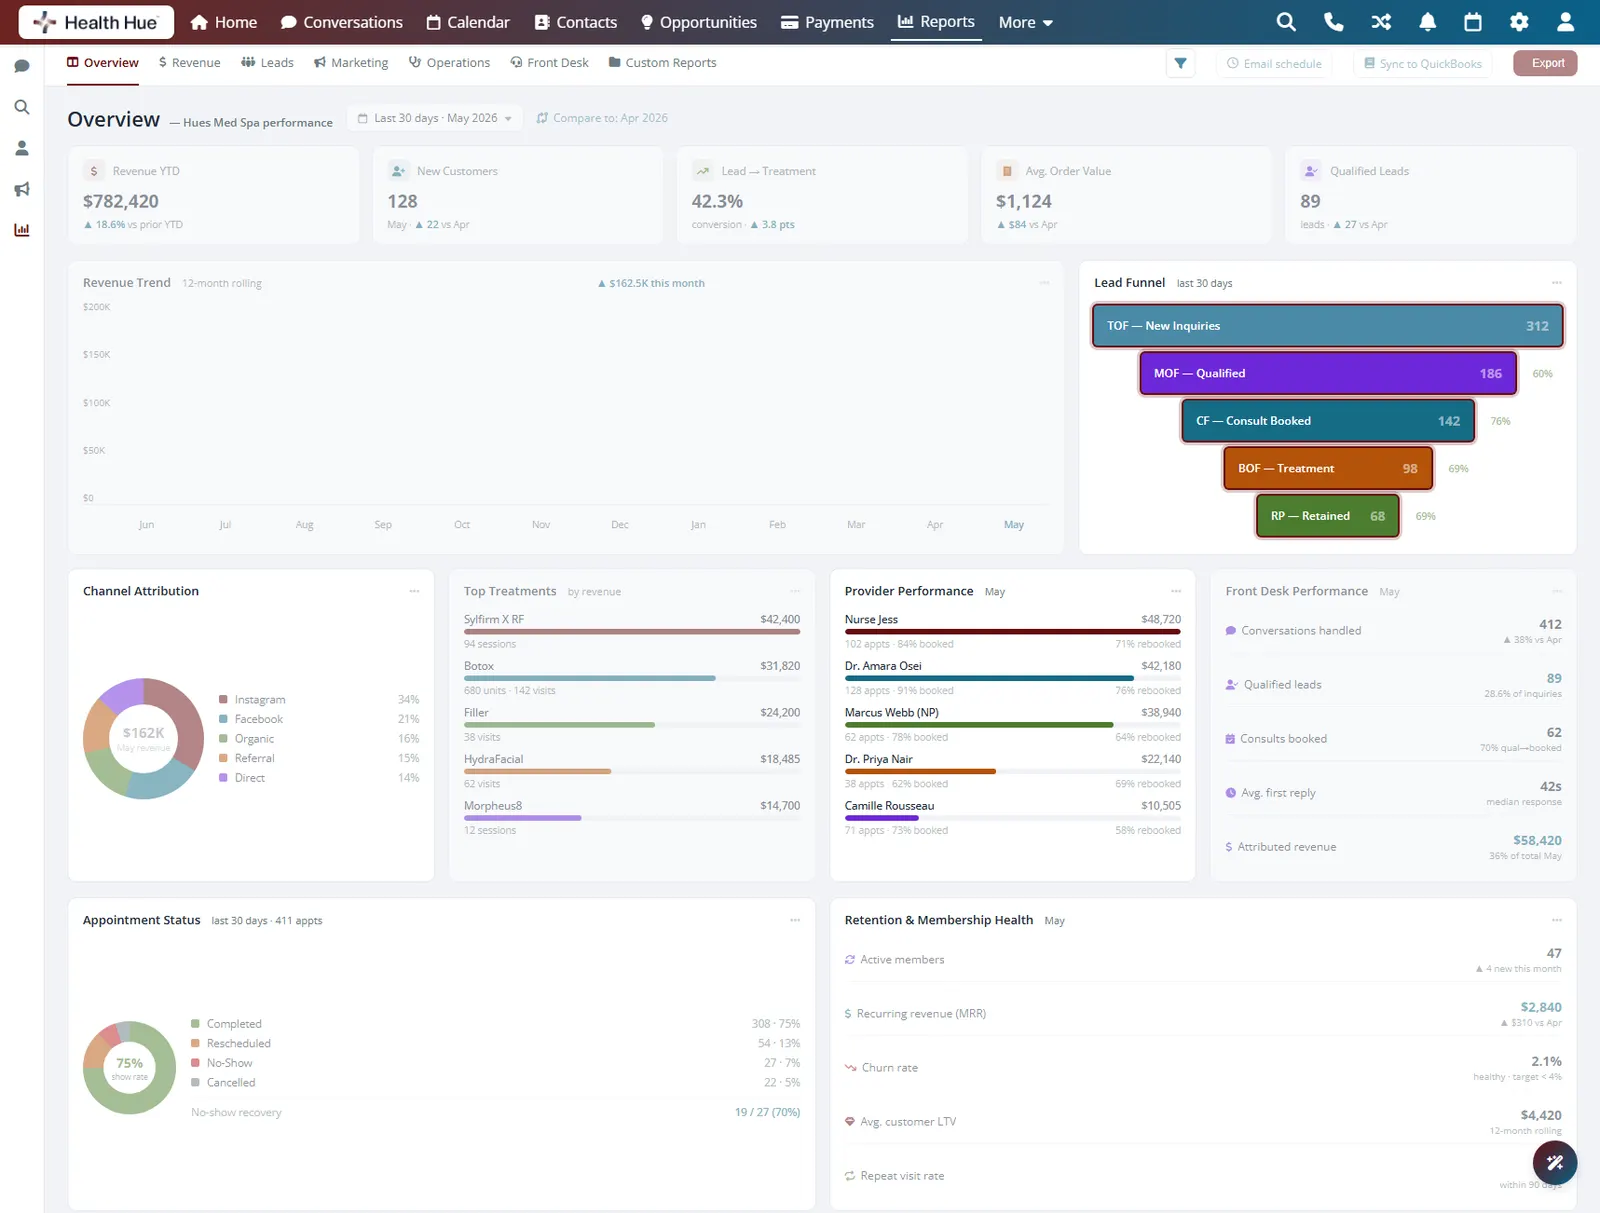
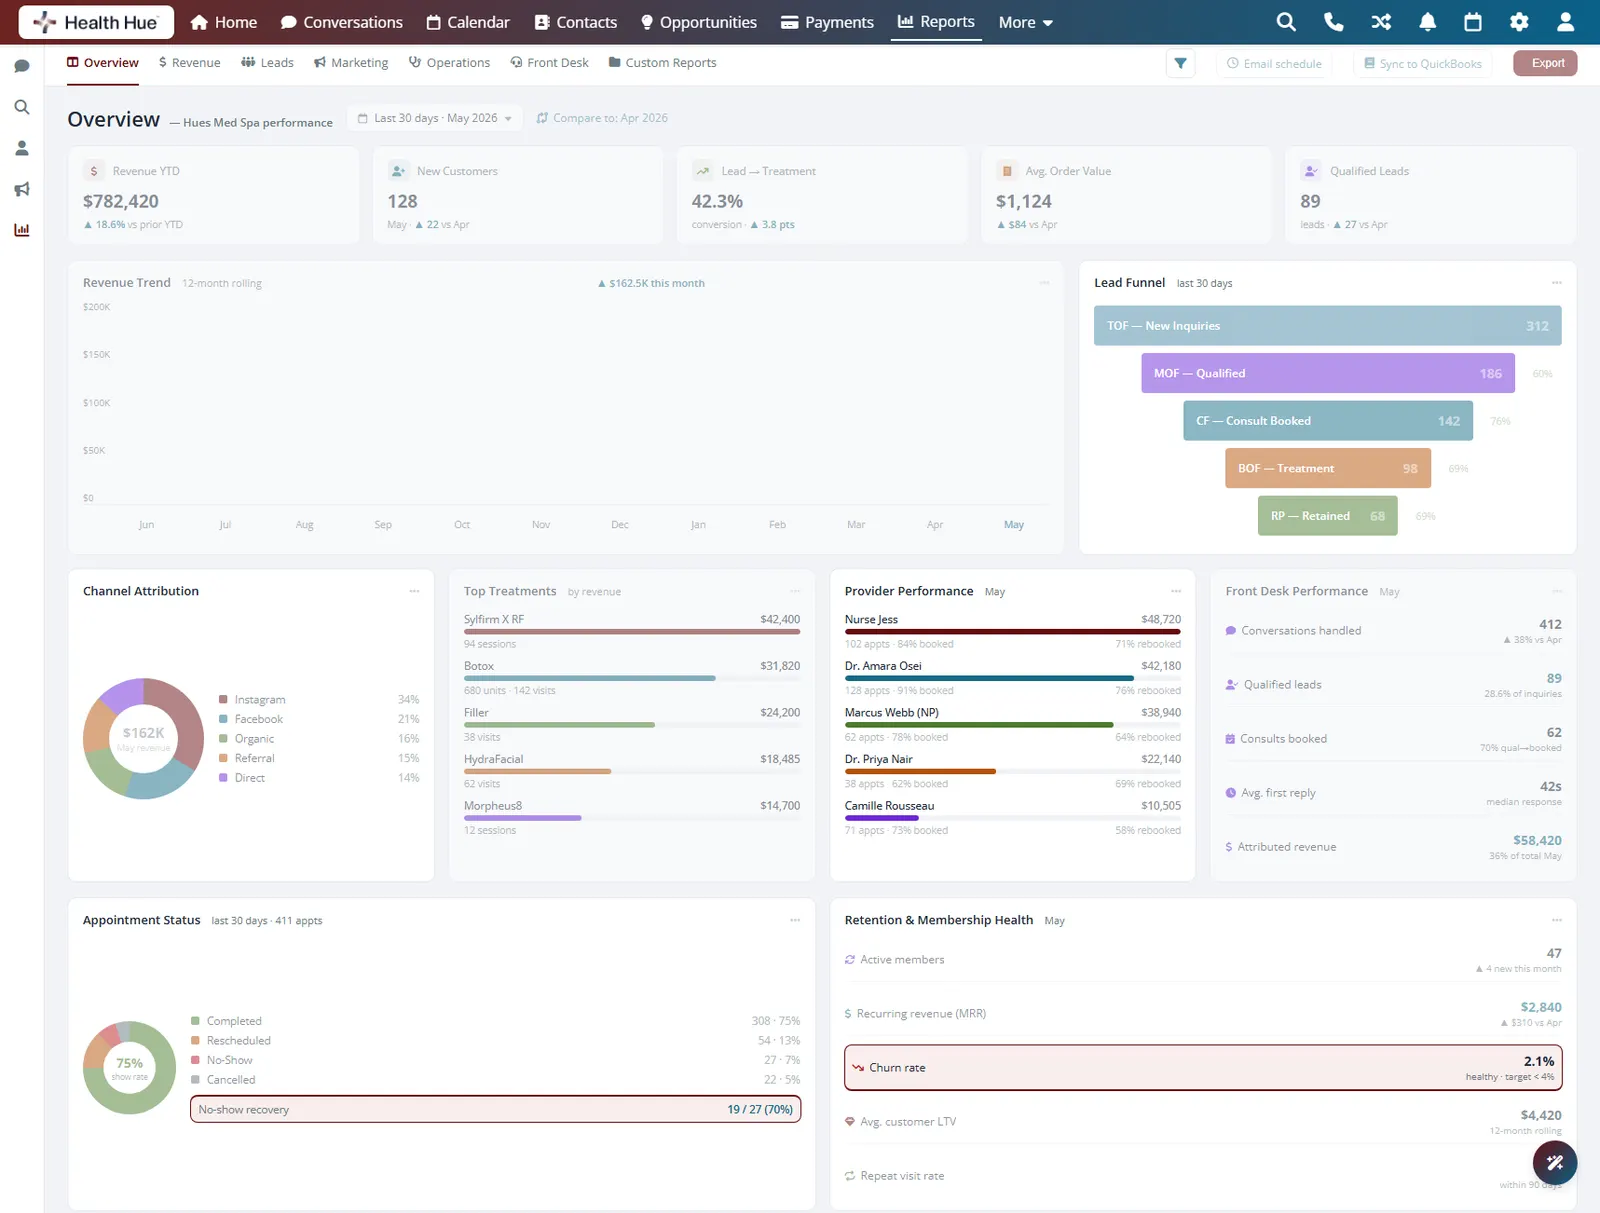
02 · Lead Funnel
Watch leads turn into booked revenue.
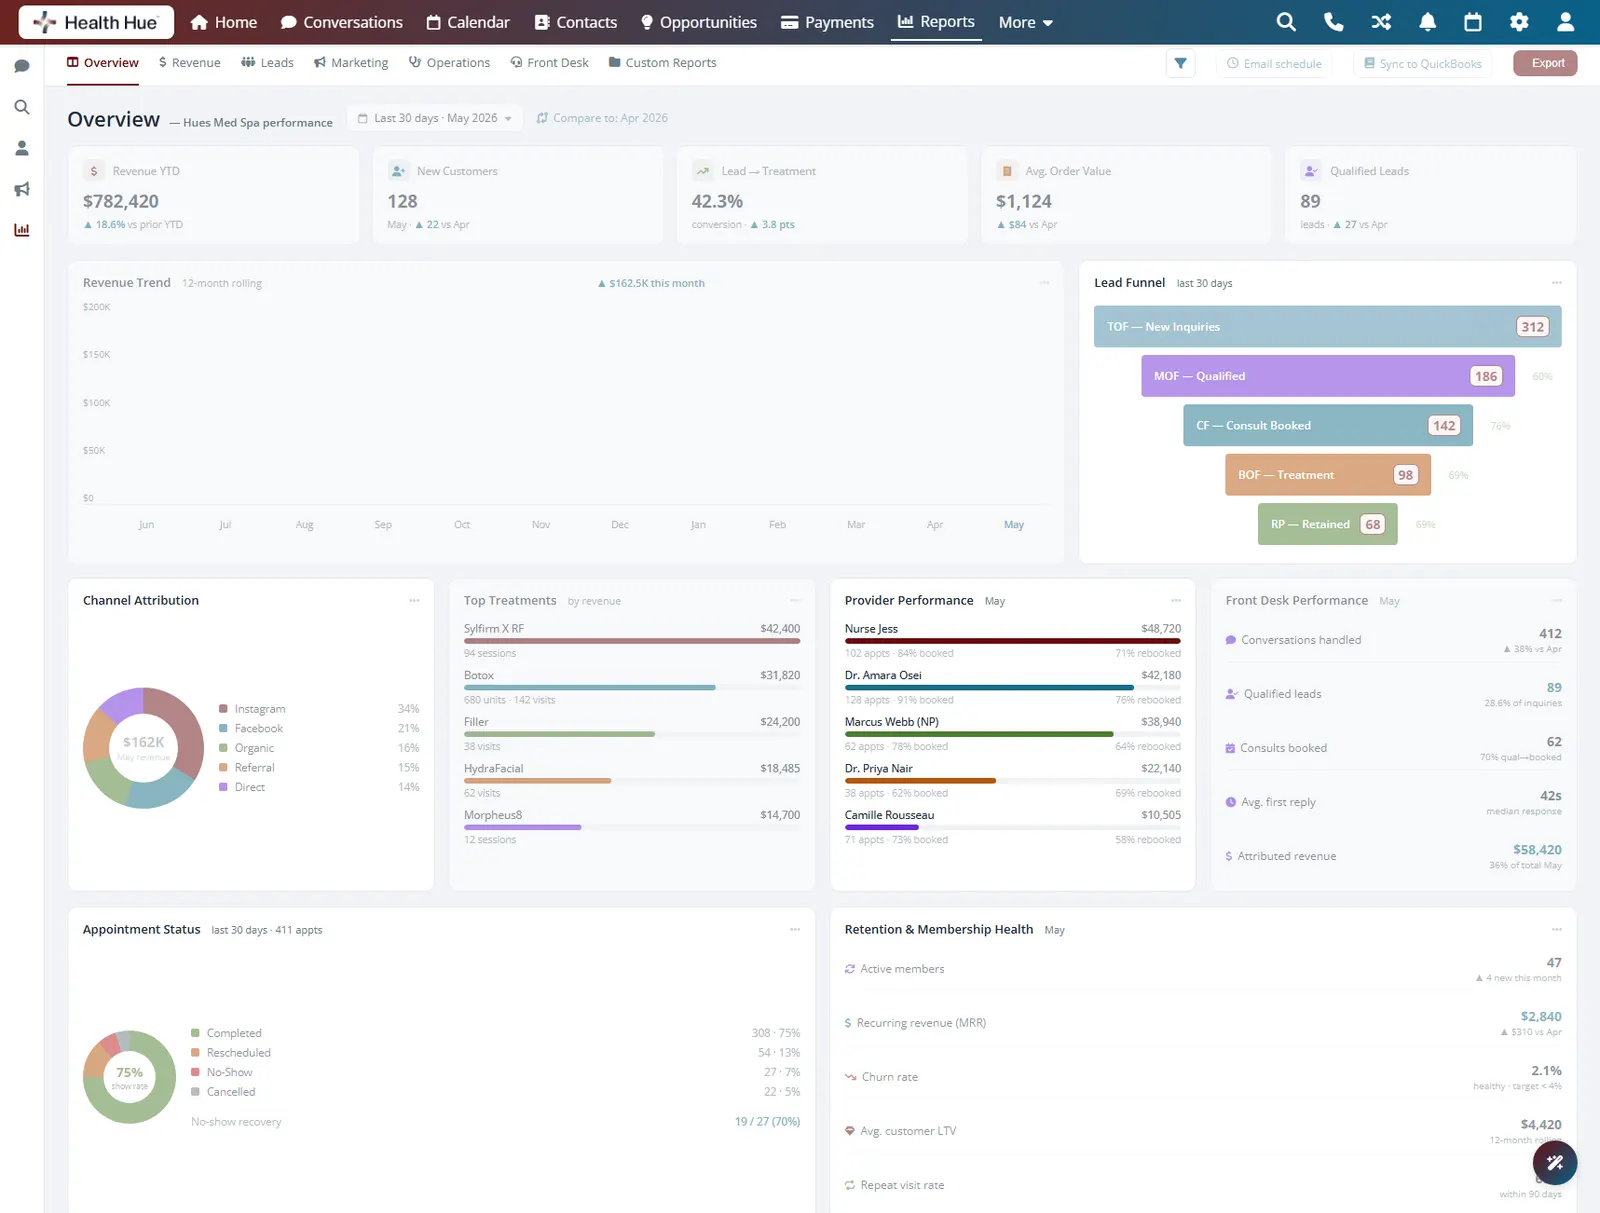
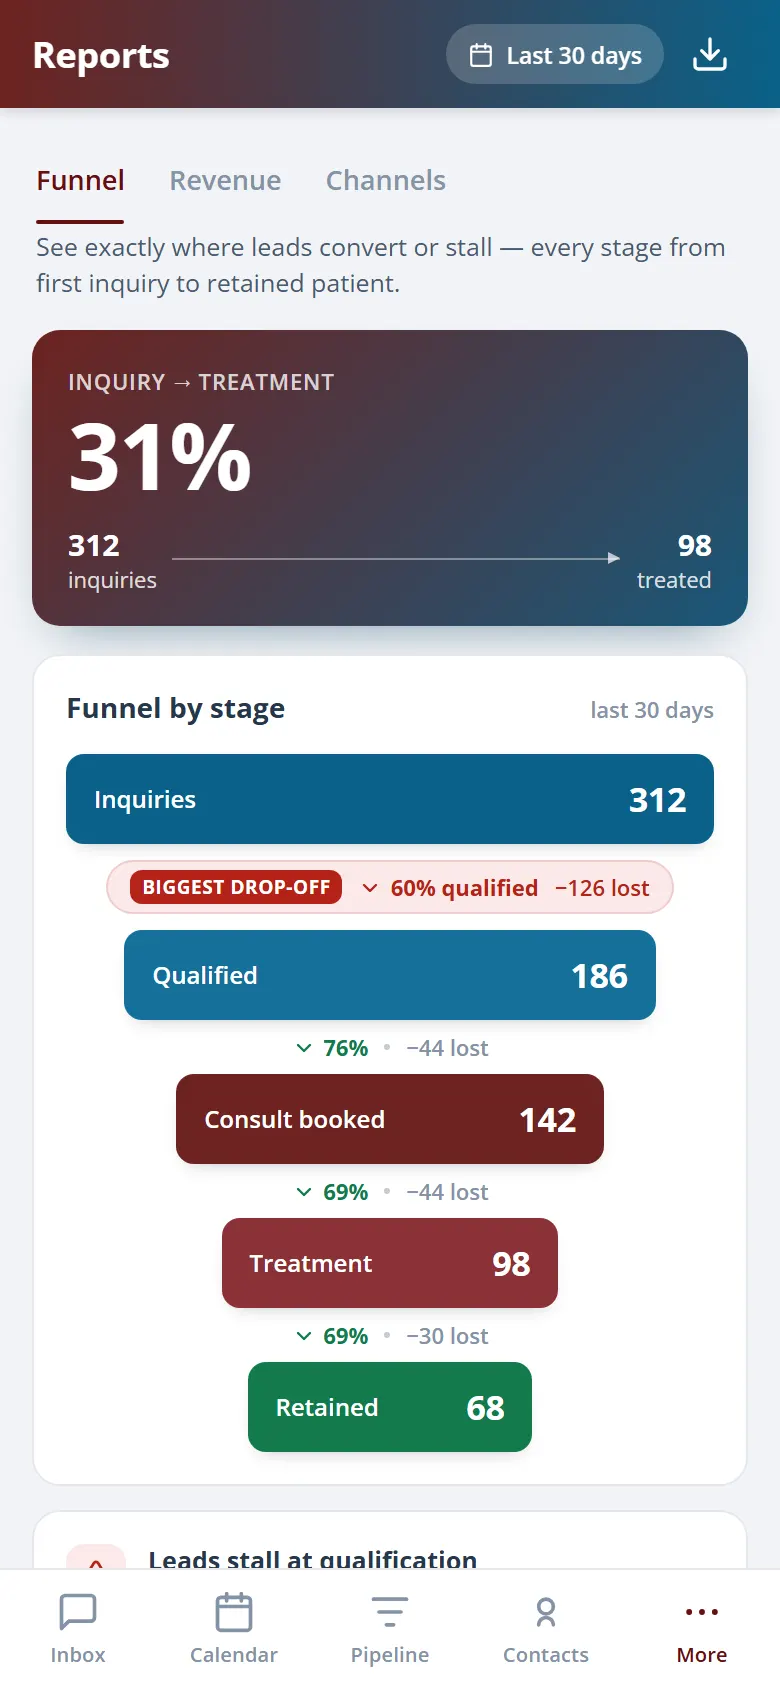
Every stage of the journey is counted for you: leads in, consults booked, deposits collected, and treatments completed. You can see exactly where patients drop off and what each stage is worth, so you fix the leak instead of guessing.
Leads, consults, deposits, and completed treatments, counted.
The rate from lead to booked patient, tracked over time.
What each stage is worth so you prioritise the right fix.
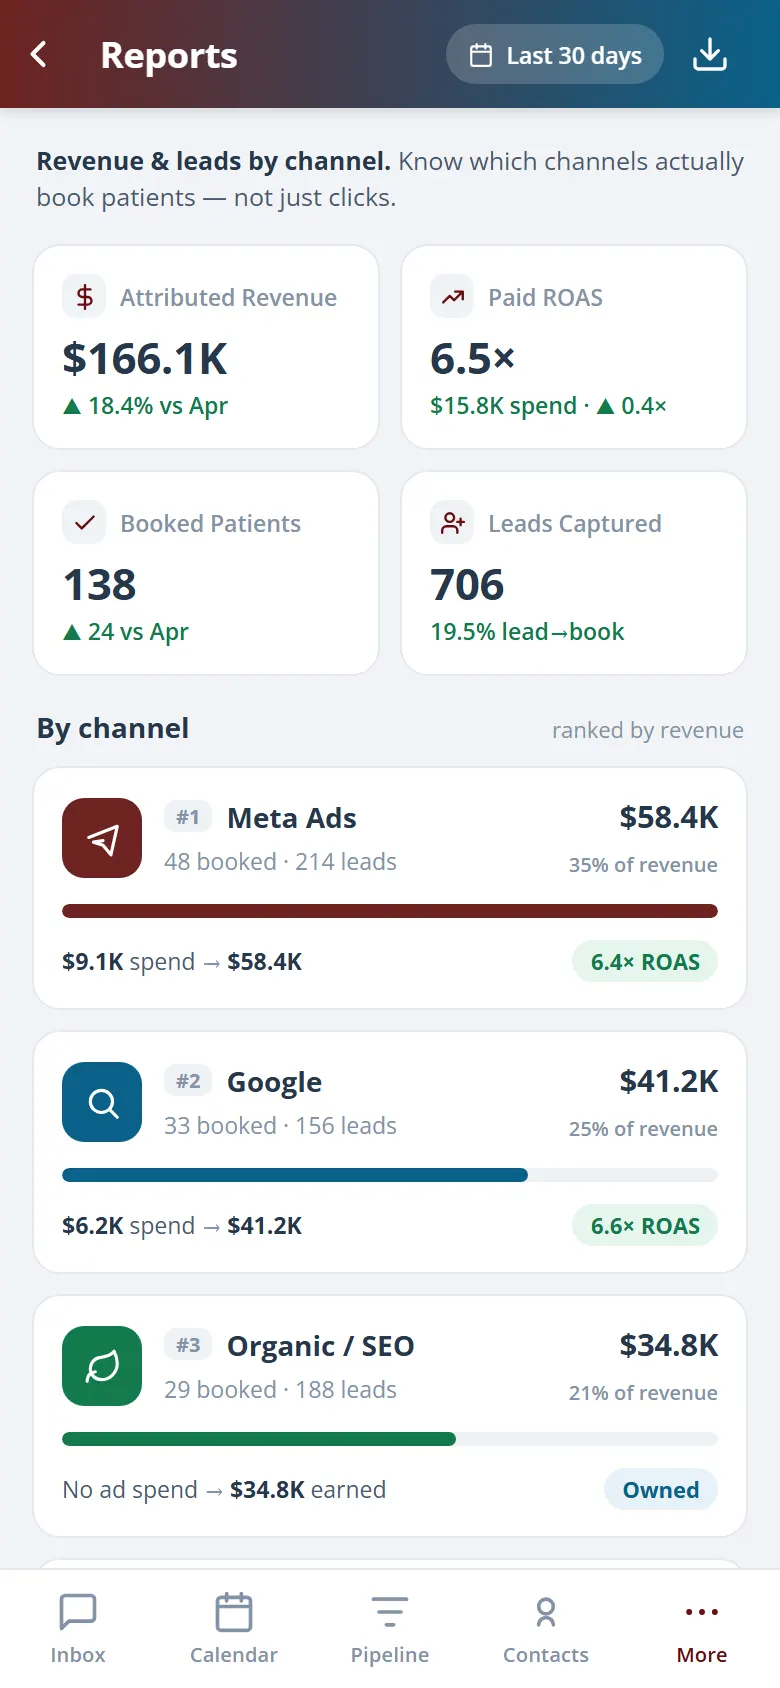
03 · Channel Attribution
Know which marketing actually paid off.
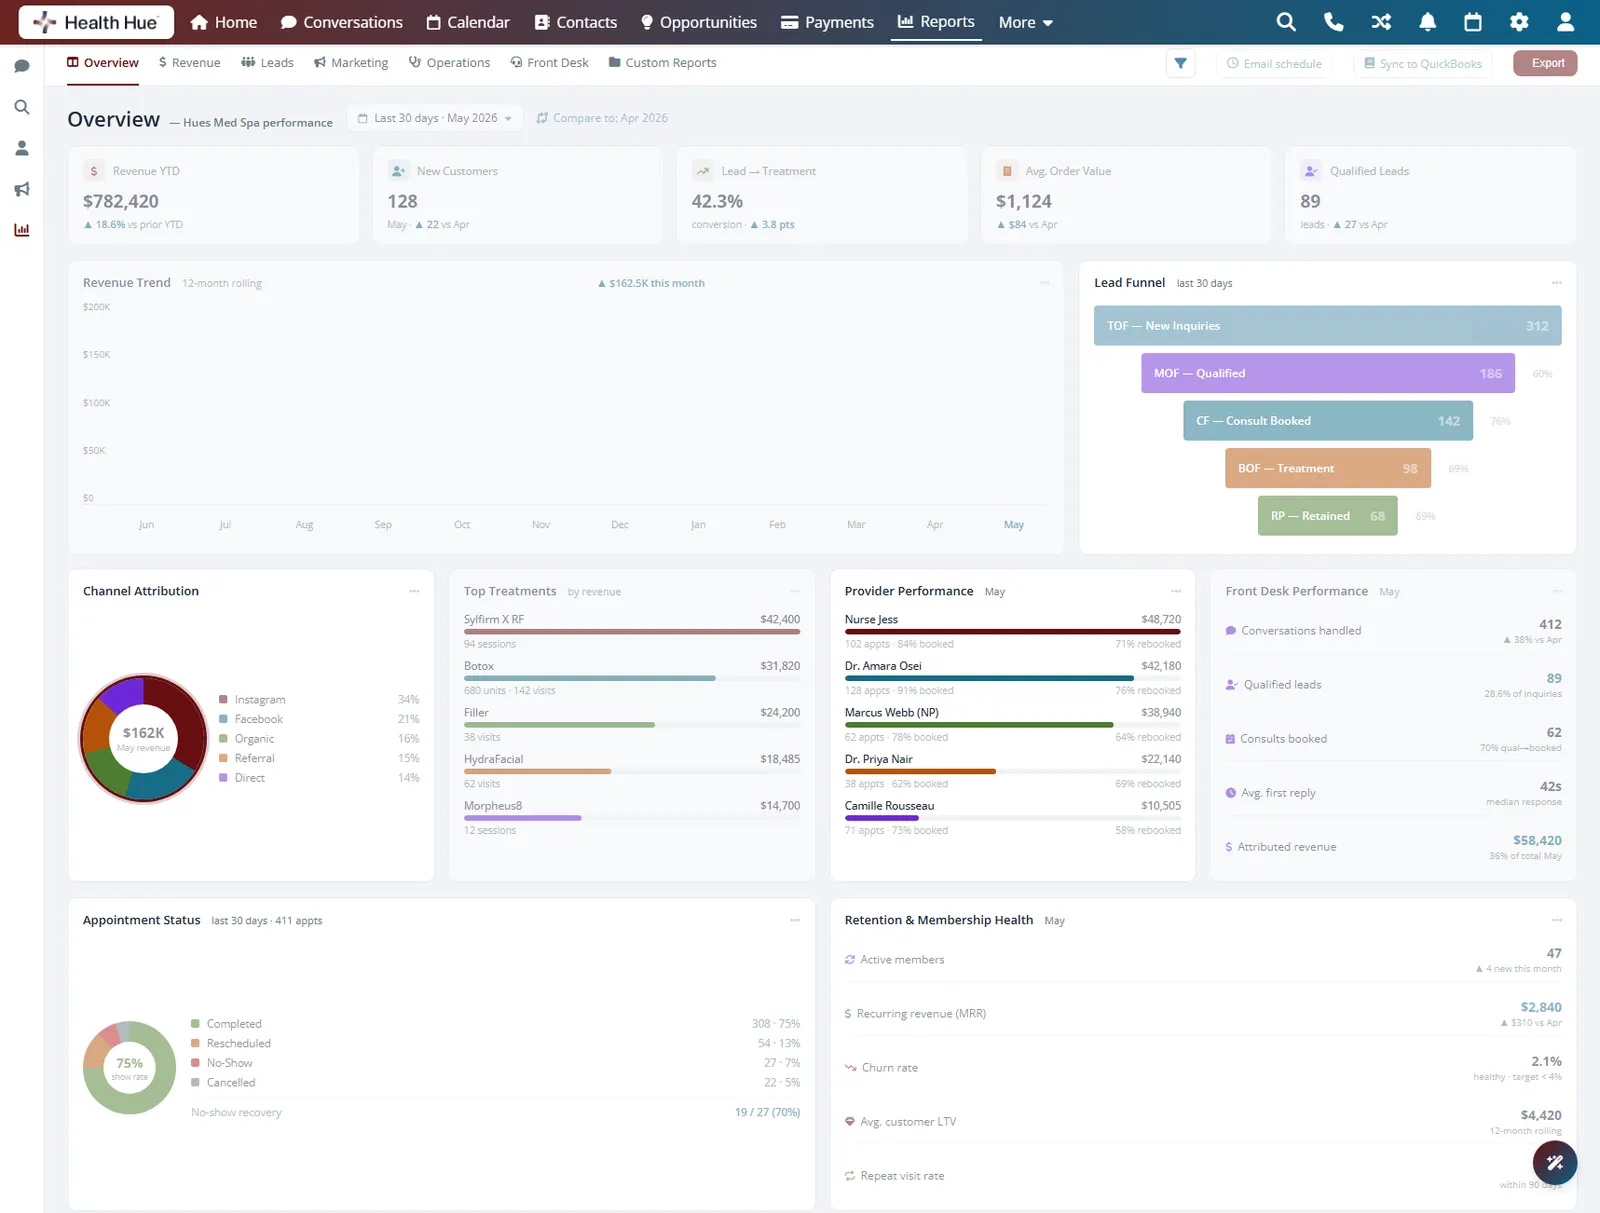
Because every patient record carries its first-touch source, your reporting ties booked revenue back to the ad, campaign, or referral that produced it. You can finally see cost per booked patient by channel instead of trusting a platform's own click count.
Meta, Google, referral, and organic, side by side.
Spend divided by patients actually booked, not clicks.
Attribution that connects marketing spend to treatments sold.

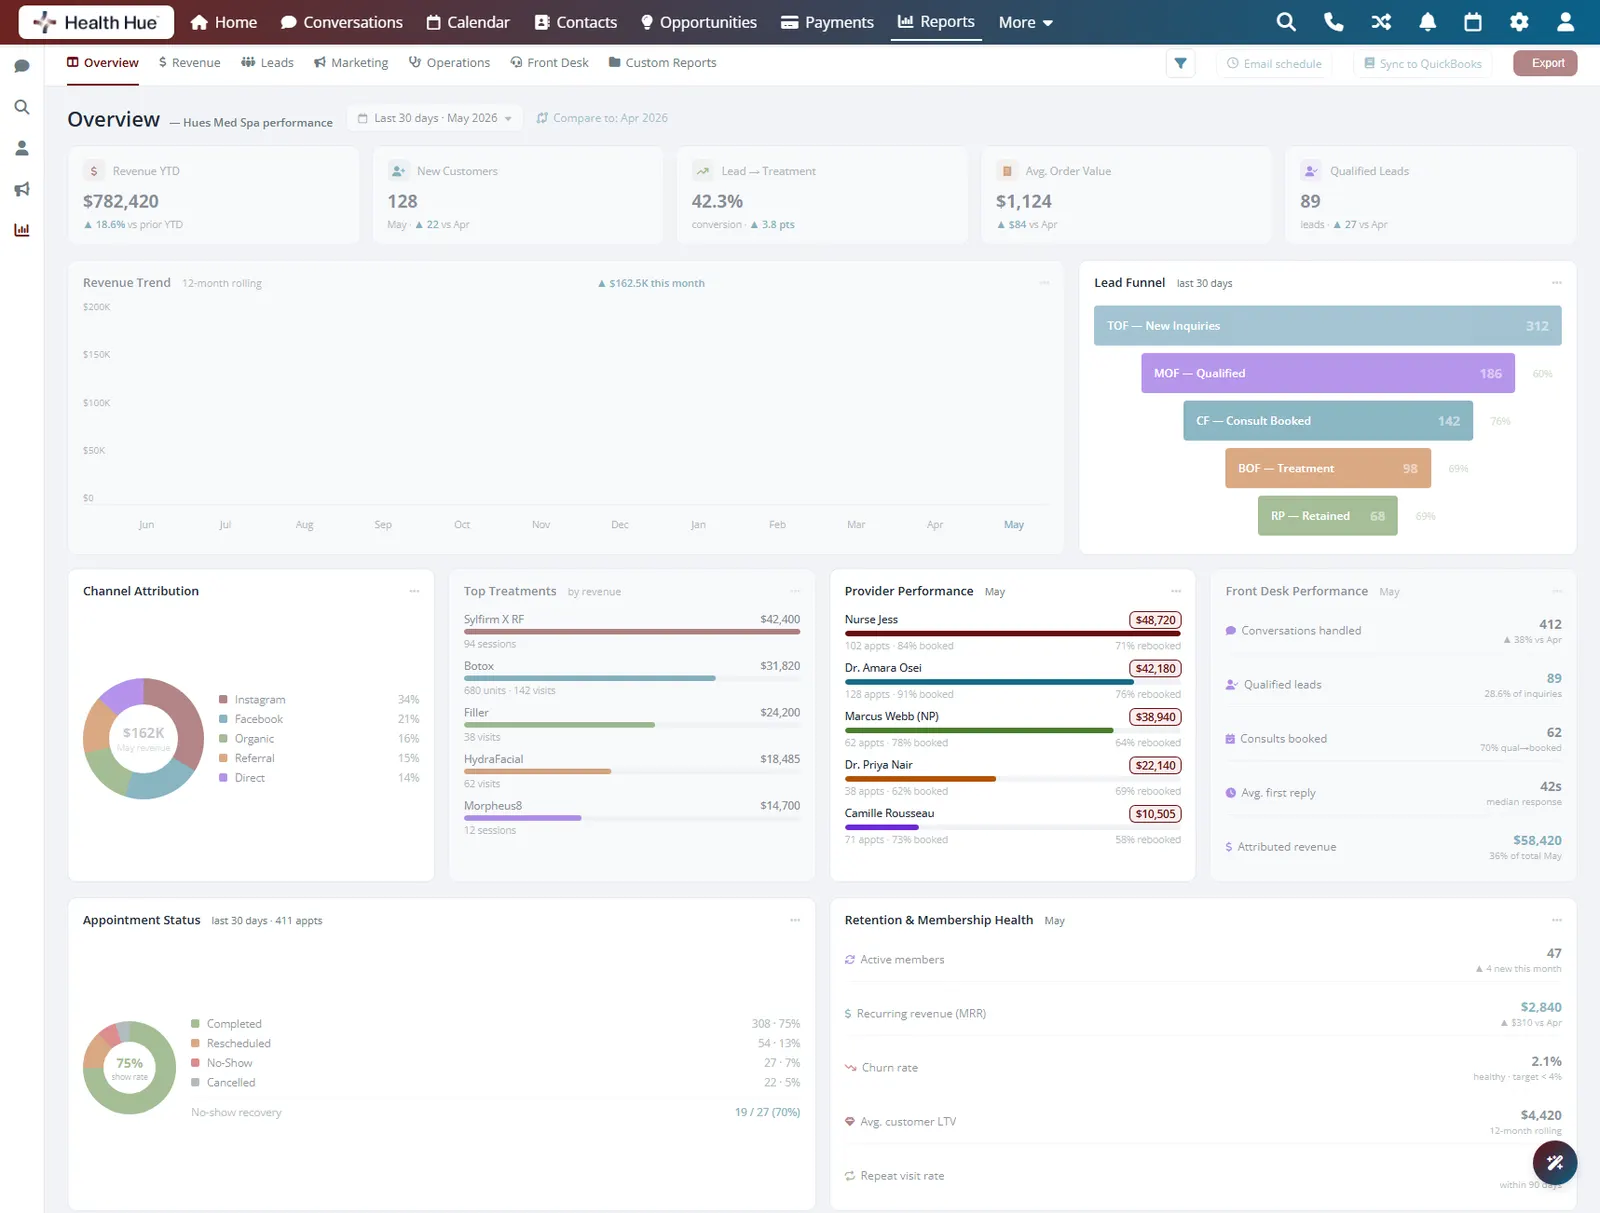
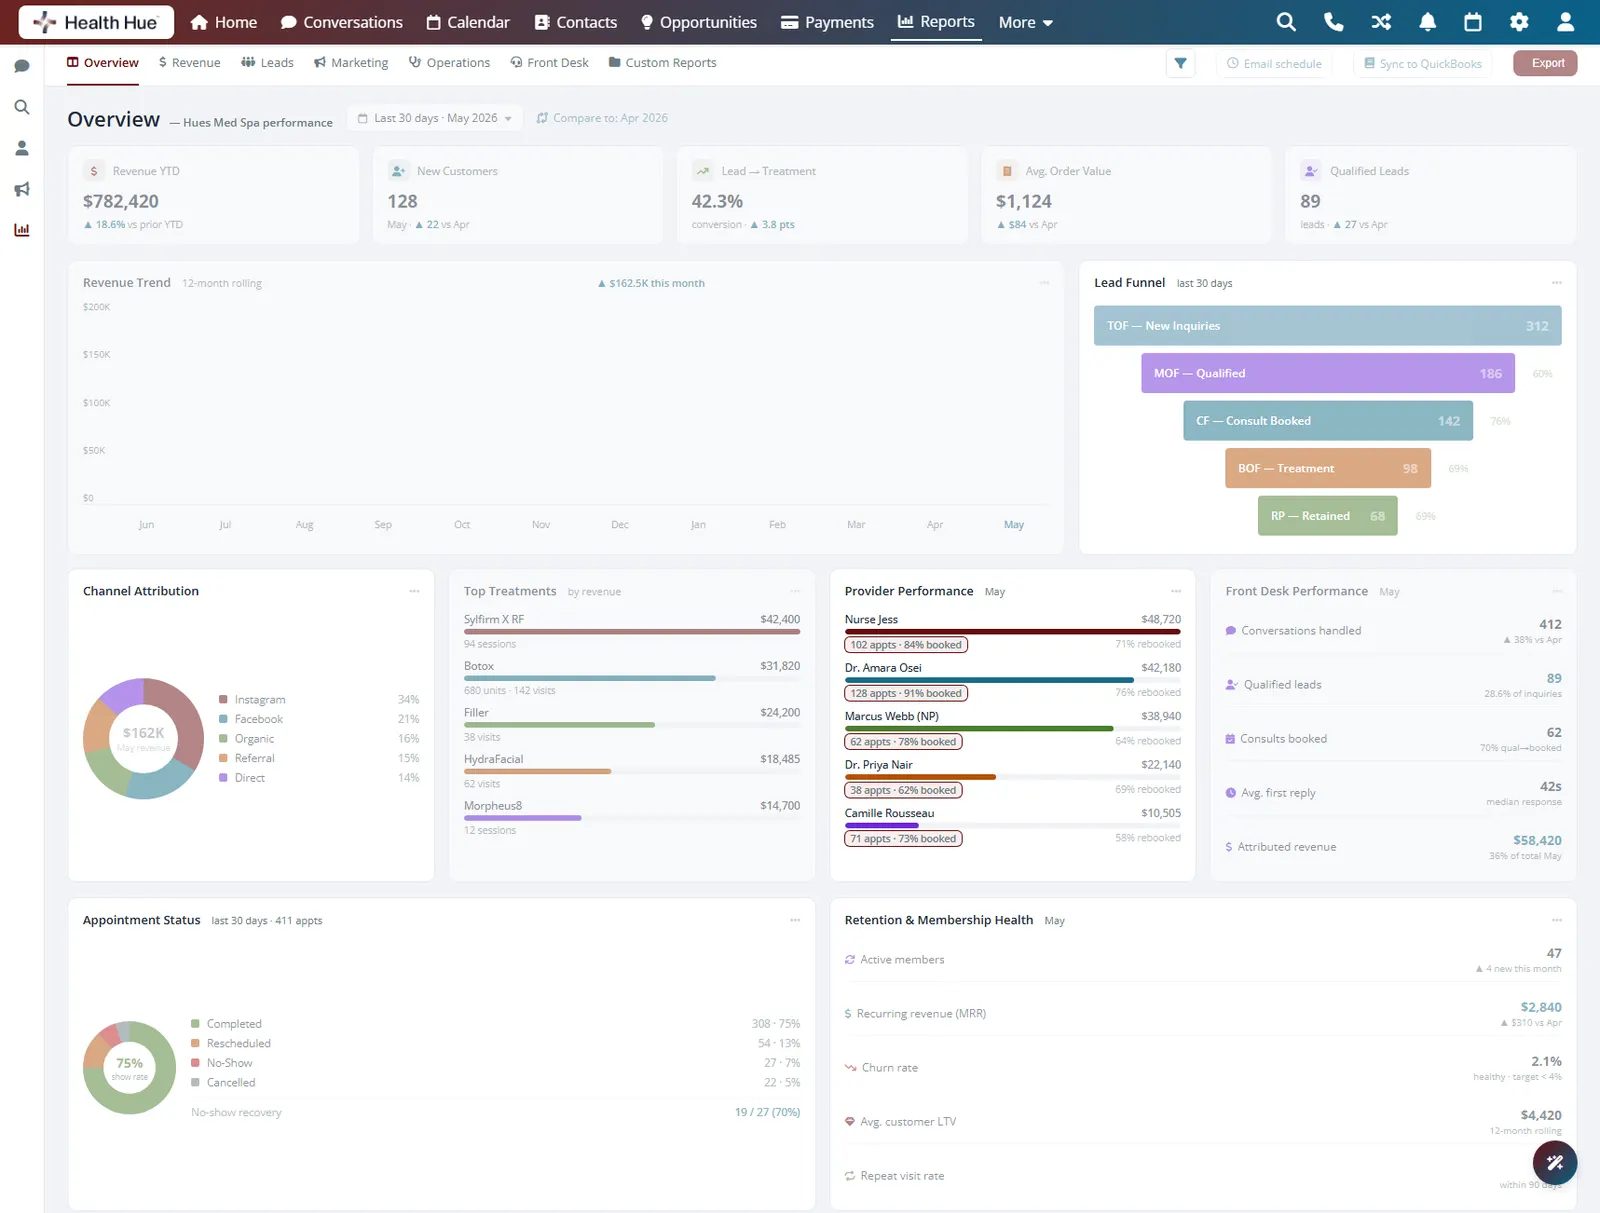
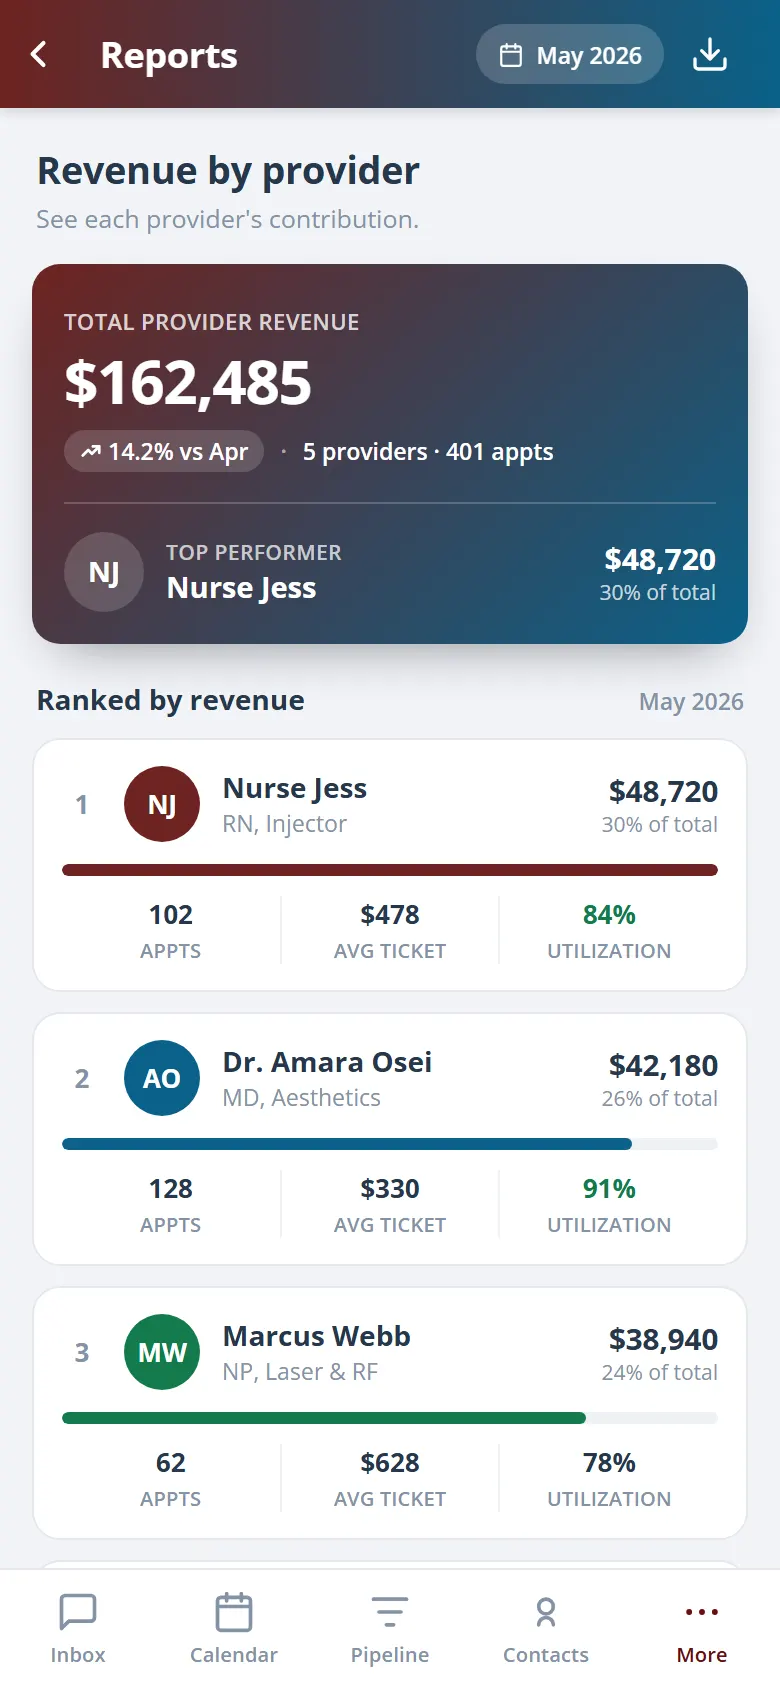
04 · Provider Performance
See how every provider is really doing.
Revenue, appointments, rebooking rate, and average ticket per provider, all in one view. Spot your strongest rebookers, balance the schedule, and coach with numbers instead of impressions.
Revenue produced by each provider for any period.
Who rebooks patients and who needs support.
Booked hours against available hours per provider.

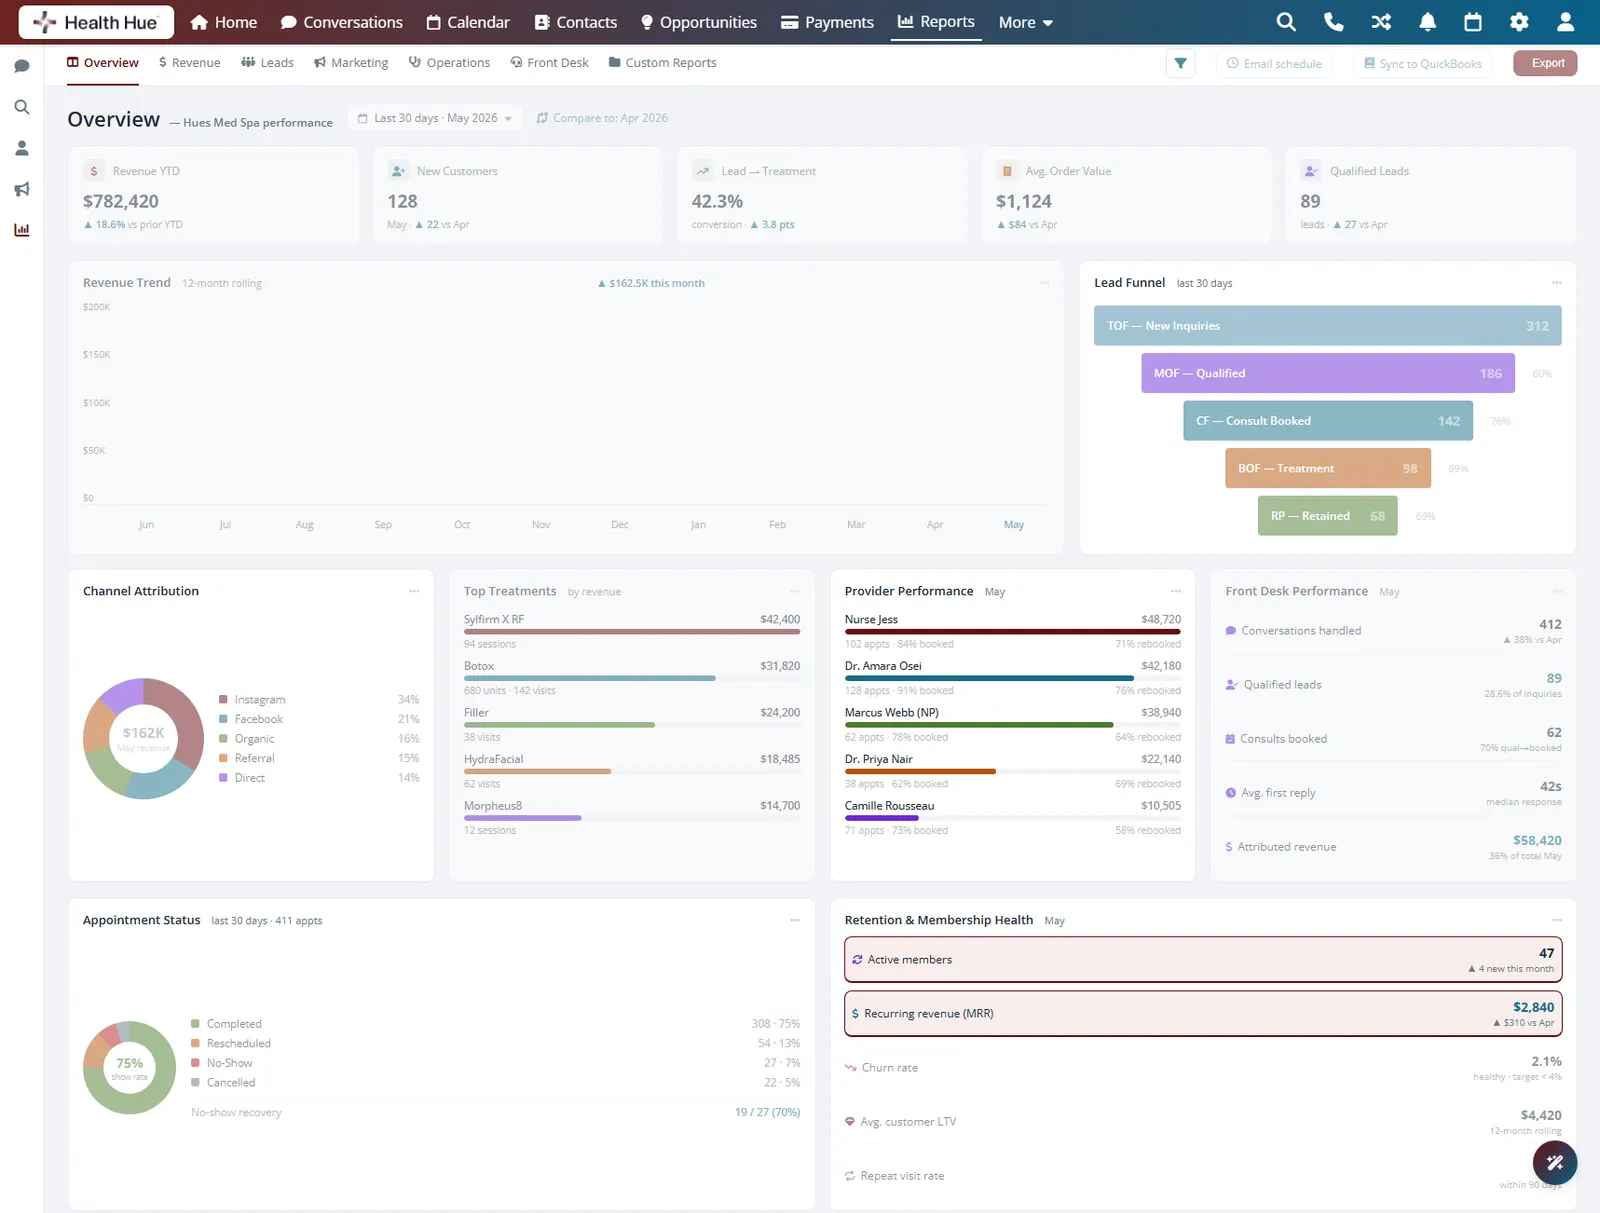
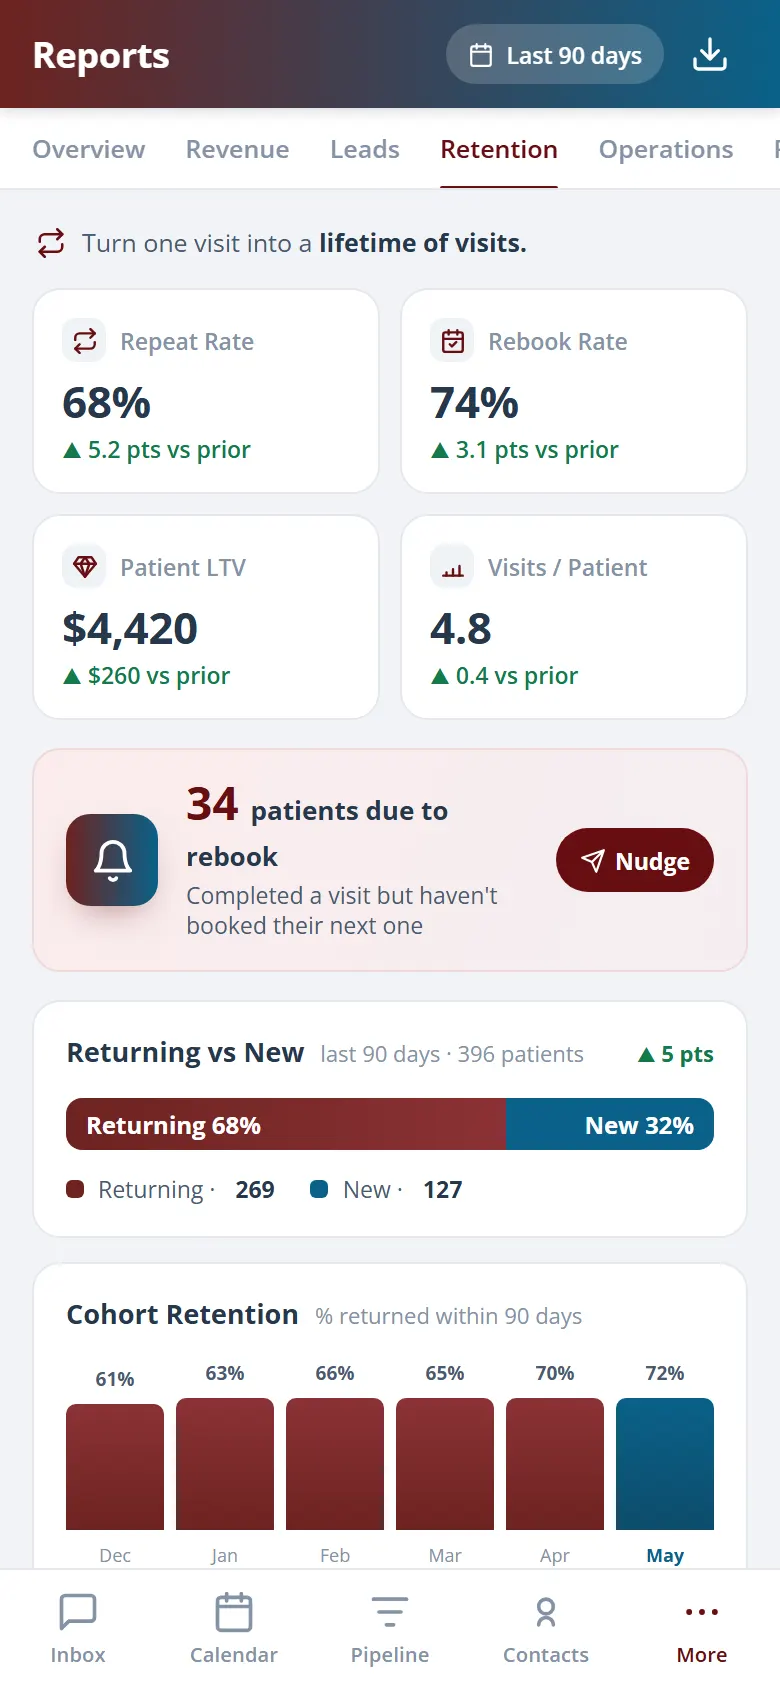
05 · Retention & Membership Health
Protect the revenue you already earned.
Track repeat-visit rate, time between visits, active memberships, and churn so you know your base is healthy. When a patient is overdue, the same platform can trigger the follow-up automatically, the loop closes inside the Hub.
How many patients come back, and how often.
Active, paused, and churned recurring revenue.
Overdue patients flagged for automatic follow-up.
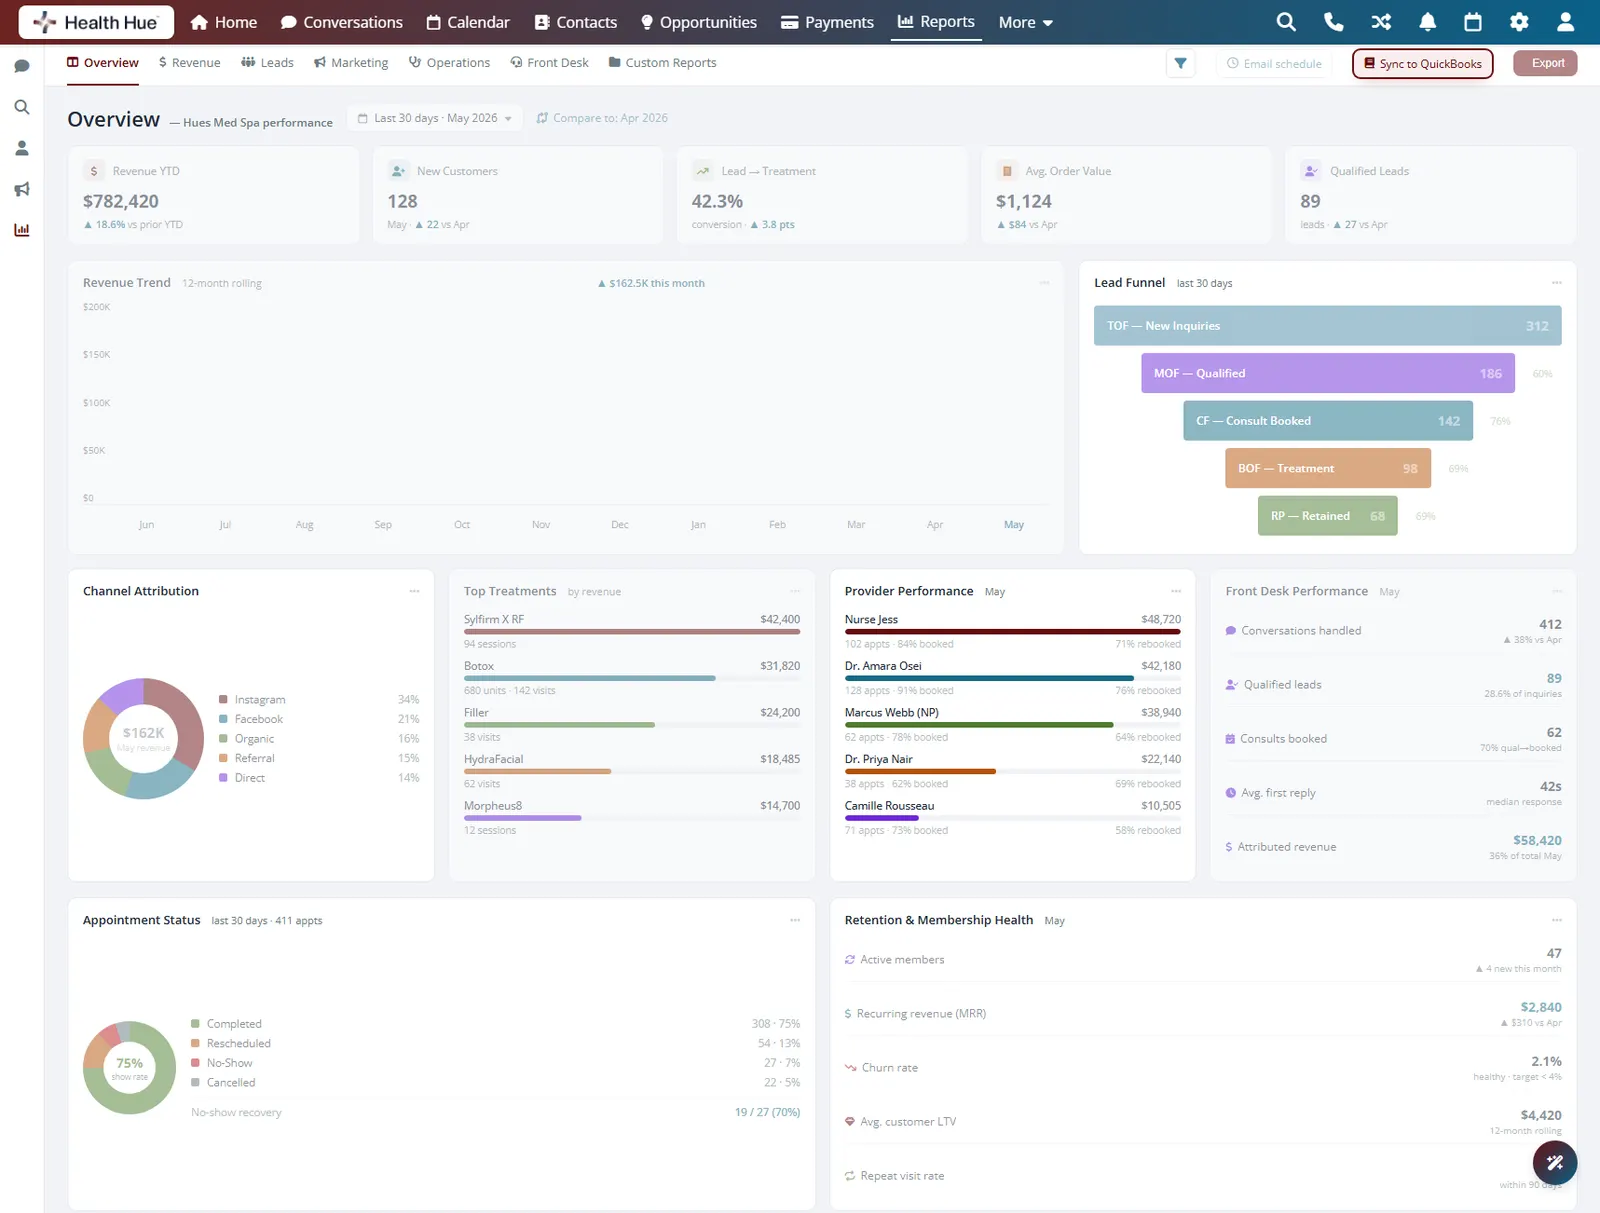
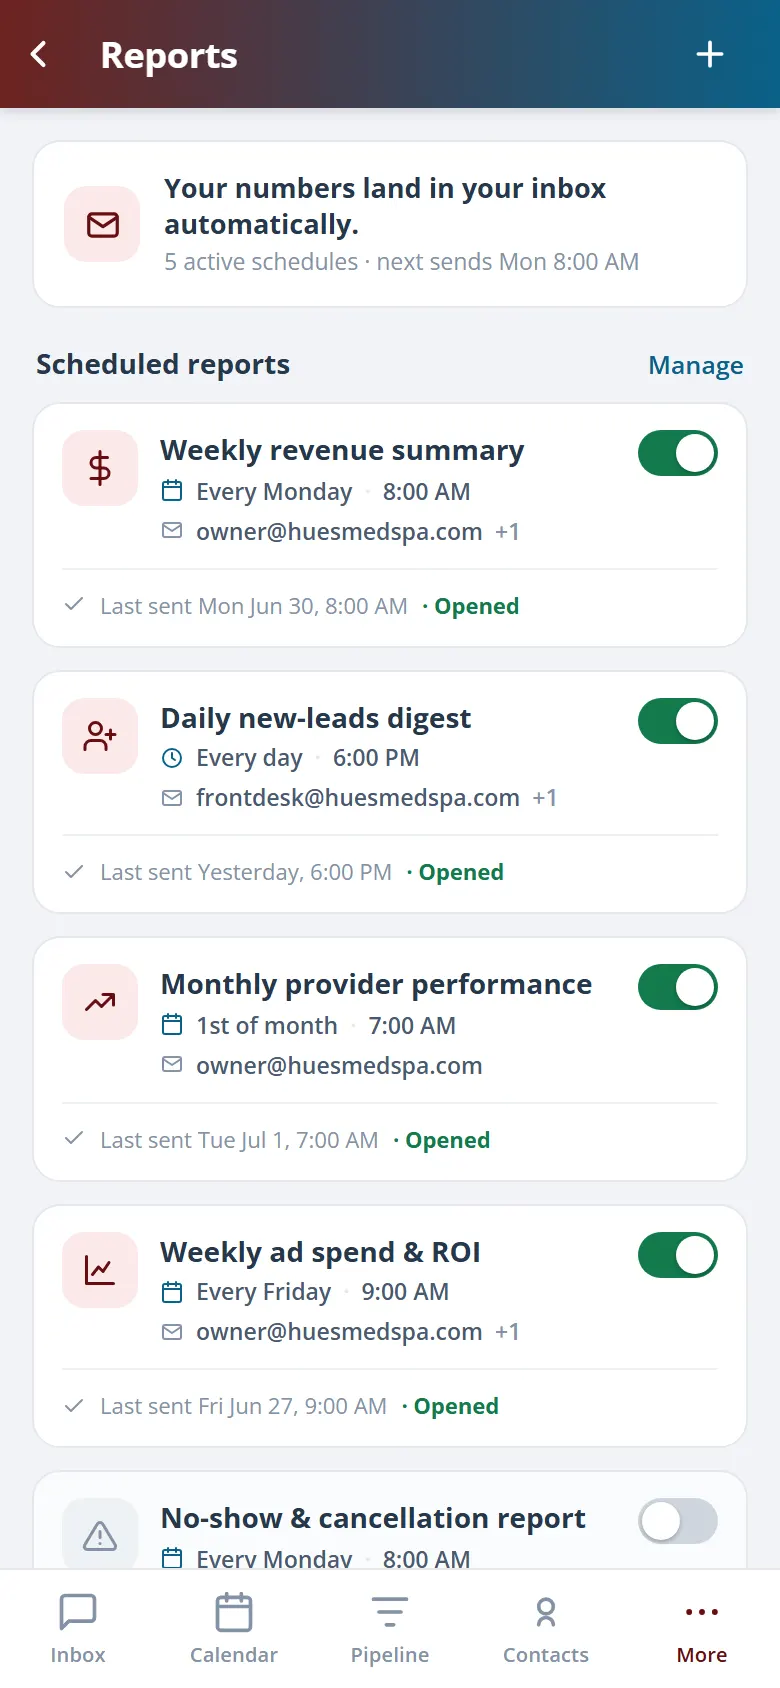
06 · Export & Share
Get the report to whoever needs it.
Send any report to email on a schedule, export to CSV for your accountant, or sync revenue to QuickBooks. The owner gets the Monday numbers without asking, and month-end close stops being a fire drill.
Key numbers land in your inbox every Monday morning.
Download any report to CSV in one click.
Revenue syncs to your books, no double entry.

Secure, compliant, and clinic-ready
Every feature lives in a platform built for clinics from the ground up, with charting, consent, and payments native to the patient record.
PHIPA & HIPAA-aware
Patient data is encrypted and handled to Canadian health-privacy standards.
Consent & audit
Consents, signatures, and changes log to the record automatically.
Role-based access
Granular permissions keep charts and contact details on a need-to-know basis.
One source of truth
Scheduling, payments, messages, and records in one place. Nothing siloed.
Explore more of the Hub
Reporting is one part of the Health Hue Hub, your AI-powered clinic operating system.
Conversations
One inbox for SMS, calls, web chat, and DMs.
Patient Records
Every patient in one complete profile.
Calendar & Scheduling
AI booking, reminders, and provider sync.
Payments & POS
Text-to-pay, deposits, and fast checkout.
Memberships
Recurring revenue, packages, and perks.
Automated Flows
Triggers and multi-channel follow-up.
FAQ